Kubernetes Dashboard Metric client health check failed #7508
Description
What happened?
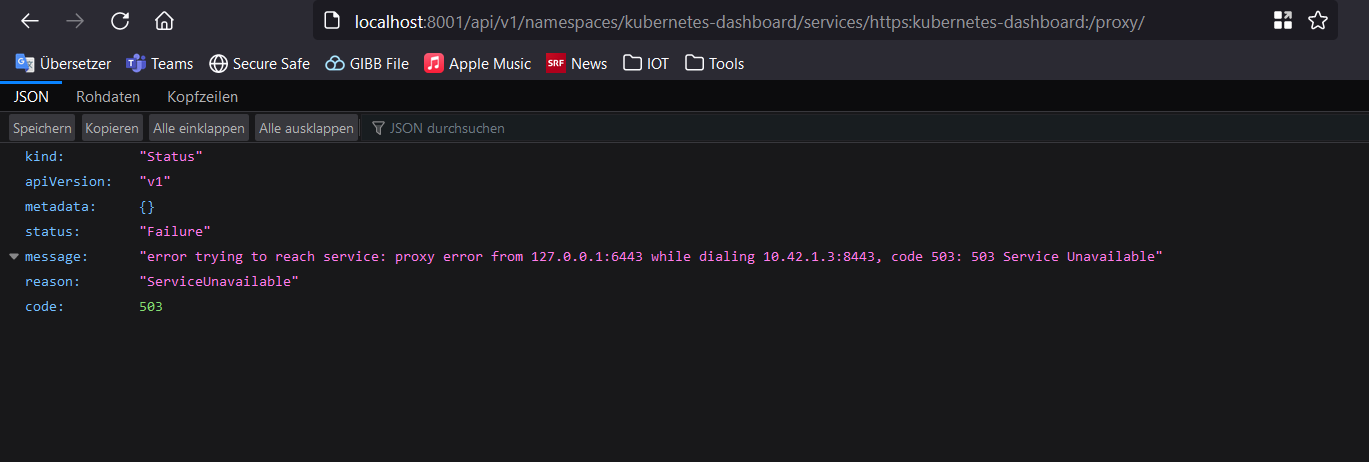
When I open the Endpoint http://localhost:8001/api/v1/namespaces/kubernetes-dashboard/services/https:kubernetes-dashboard:/proxy/ as instructed. Then the browser is trying to connect for at least two minutes. And after it I got this error message in my browser.
So I looked into the logs from the pods
I think with the dashboard-metrics-scraper is everything okay.
kubectl --namespace kubernetes-dashboard logs dashboard-metrics-scraper-8c47d4b5d-dfdlx

But when I look at the logs from the kubernetes-dashboard-67bd8fc546-flmpt I see that their is a problem with the metrics-scrapper. kubectl --namespace kubernetes-dashboard logs kubernetes-dashboard-67bd8fc546-flmpt

But I don't know how to solve this one?
What did you expect to happen?
I expected that the website would show up so that I coul enter the token.
How can we reproduce it (as minimally and precisely as possible)?
I installed a k3s cluster with three nodes.

I deployed the Kubernetes dashboard on the cluster.

After this I installed the dashboard with the official documentation.
Anything else we need to know?
No response
What browsers are you seeing the problem on?
Chrome, Firefox
Kubernetes Dashboard version
2.7.0
Kubernetes version
v1.24.6+k3s1
Dev environment
No response