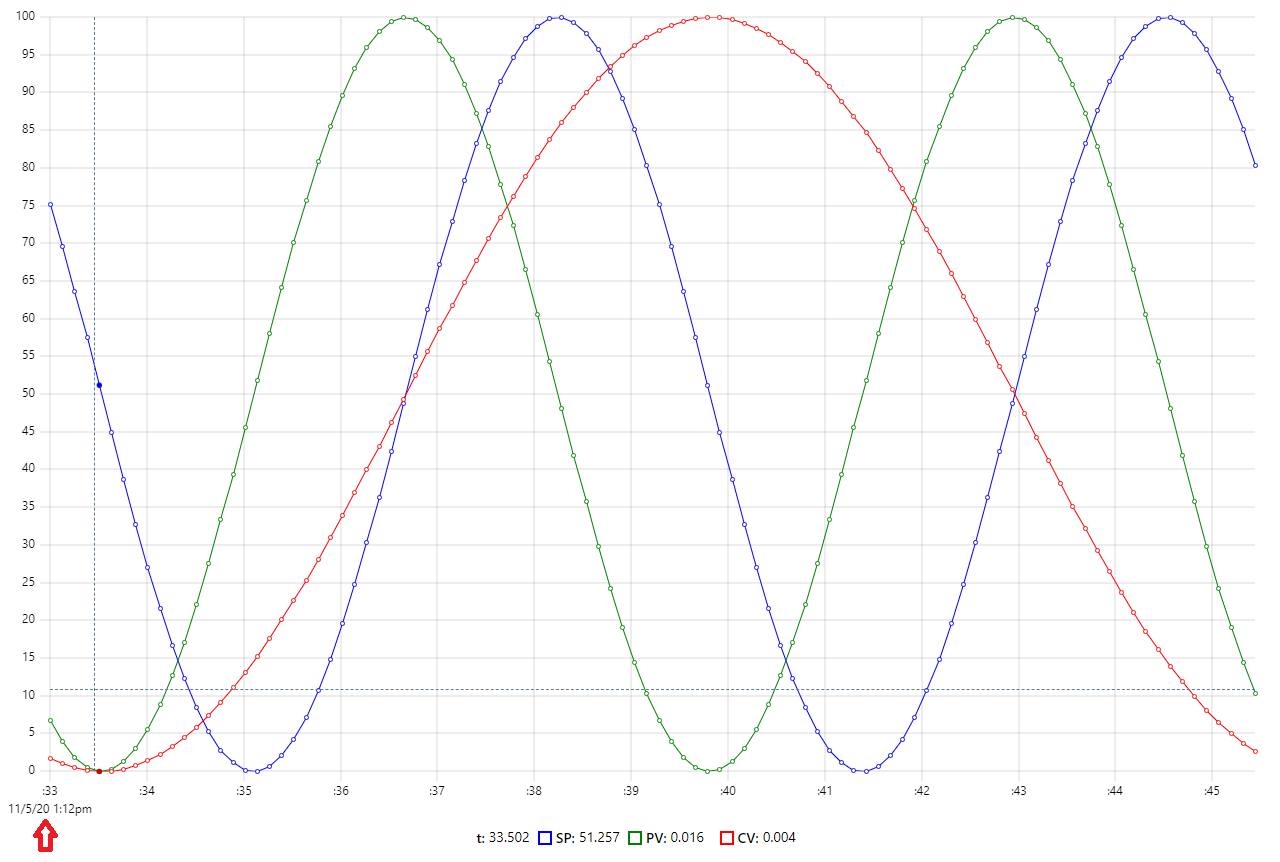
Hello. Little Javascript knowledge here. How can I change the date format in the x Axis dynamic label? (red arrow in the screenshot) Basically I want to change it to day/month/year instead of month/day/year
I was able to display milliseconds in the "t:" with
tzDate: ts => uPlot.tzDate(new Date(ts * 1e3), 'Etc/UTC'),
and
series: [ { label: "t", value: (u, ts) => fmtDate(tzDate(ts)), }
but I can't find a way to use fmtDate to change the x label as I want
Hello. Little Javascript knowledge here. How can I change the date format in the x Axis dynamic label? (red arrow in the screenshot) Basically I want to change it to day/month/year instead of month/day/year
I was able to display milliseconds in the "t:" with
tzDate: ts => uPlot.tzDate(new Date(ts * 1e3), 'Etc/UTC'),and
series: [ { label: "t", value: (u, ts) => fmtDate(tzDate(ts)), }but I can't find a way to use fmtDate to change the x label as I want