Fix kubernetes grafana dashboard (#4380)#5012
Conversation
 Pothulapati
left a comment
Pothulapati
left a comment
There was a problem hiding this comment.
Thanks for taking this up! I have a small nit around pod_name
| "interval": "10s", | ||
| "intervalFactor": 1, | ||
| "legendFormat": "{{ pod_name }}", | ||
| "legendFormat": "{{ pod_name }}{{ pod }}", |
There was a problem hiding this comment.
Is pod_name still a correct label? because all I can see in the dashboard is it being statically printed.
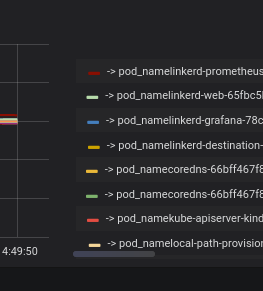
Should we just remove it? as I see {{ pod }} is added everywhere it is present?
There was a problem hiding this comment.
As suggested by alpeb in #4393 I've letted pod and pod_name in order to keep things compatible.
Can you tell me what version did you used ? Have you used kind or minikube or ... ?
Thank's for you answers
There was a problem hiding this comment.
@Pothulapati That's weird since pod_name should just be empty... Although I did try after merging main that brings a new version of Grafana. @aimbot31 could you please merge main to your branch so we can give it another test?
There was a problem hiding this comment.
Yup i don't understand this because i'm not seeing pod or pod_name, just the only value filled.
There was a problem hiding this comment.
Awesome, Works now. and I don't see pod_name anymore.
Prometheus use a relabel rule that changed since 1.16

Use "pod_name" and "pod" to avoid breaking changes.
Alse use "container" and "container_name" for the
same reasons.

Run some tests on the Grafana dashboard

Fixes linkerd#4380

Signed-off-by: Florian Davasse <florian.davasse@stack-labs.com>
Prometheus use a relabel rule that changed since 1.16
Use "pod_name" and "pod" to avoid breaking changes.
Alse use "container" and "container_name" for the
same reasons.
Run some tests on the Grafana dashboard
Fixes #4380
Signed-off-by: Florian Davasse florian.davasse@stack-labs.com