- Created a tool that determines data science track to help students study courses they are needed
- download data over 65,000 developers told us how they learn and level up, which tools they’re using, and what they want from stackoverflow
- Engineered features from the text of each job description to quantify the value companies put on python
- Optimized Logistic regression as baseline, Vanilla Forest, Random Forest with Non-linearity, Random Forest with PCAs & Hyper parameter tuning. and trak them usin mlflow
- Built a client facing API using flask
1- Higher enrollment rate due to the higher certainty
2- Decrease in drop-out rate
3- Time saved for the academic advisors
Python Version: 3.7 Packages: pandas, numpy, sklearn, matplotlib, seaborn, flask, json, pickle
For Web Framework Requirements: pip install -r requirements.txt
Flask Productionization: https://towardsdatascience.com/productionize-a-machine-learning-model-with-flask-and-heroku-8201260503d2
mlflow tutorial: https://www.mlflow.org/docs/latest/tutorials-and-examples/tutorial.html
Data : https://insights.stackoverflow.com/survey/2020
Cookie-cutting your directory structure : https://cookiecutter.readthedocs.io/en/1.7.2/first_steps.html
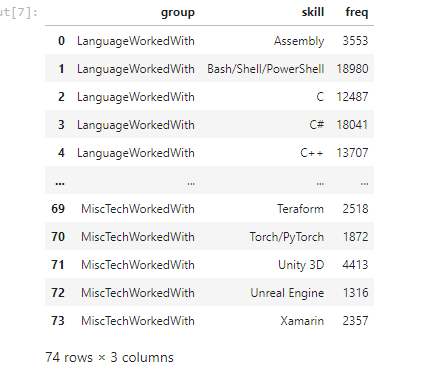
I looked at the distributions of the data and the value counts for the various categorical variables. Below are a few highlights from the pivot tables.
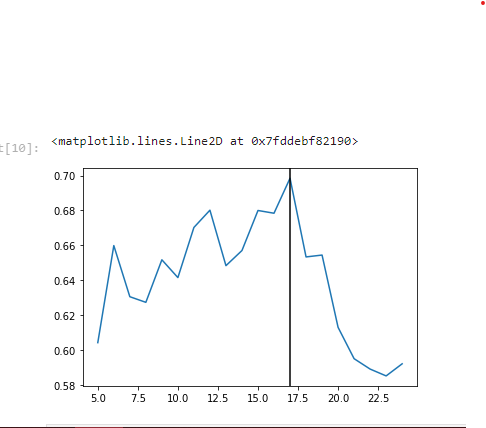
First, I transformed the categorical variables into dummy variables. I also split the data into train and tests sets. I tried three different models and evaluated them using Mean Absolute Error. I chose MAE because it is relatively easy to interpret and outliers aren’t particularly bad in for this type of model. I tried three different models: Logistic Regression: – Baseline for the model
Random Forest: – Because of the sparse data from the many categorical variables, I thought a normalized regression like lasso would be effective.
Random Forest with PCAs & Hyper parameter tuning: – Again, with the sparsity associated with the data, I thought that this would be a good fit.
In this step, I built a flask API endpoint that was hosted on a local webserver by following along with the TDS tutorial in the reference section above. The API endpoint takes in a request with a list of values from a job listing and returns an estimated salary.
├── LICENSE
├── Makefile           <- Makefile with commands like `make data` or `make train`
├── README.md          <- The top-level README for developers using this project.
├── data
│   ├── external       <- Data from third party sources.
│   ├── interim        <- Intermediate data that has been transformed.
│   ├── processed      <- The final, canonical data sets for modeling.
│   └── raw            <- The original, immutable data dump.
│
├── docs               <- A default Sphinx project; see sphinx-doc.org for details
│
├── models             <- Trained and serialized models, model predictions, or model summaries
│
├── notebooks          <- Jupyter notebooks. Naming convention is a number (for ordering),
│                         the creator's initials, and a short `-` delimited description, e.g.
│                         `1.0-jqp-initial-data-exploration`.
│
├── references         <- Data dictionaries, manuals, and all other explanatory materials.
│
├── reports            <- Generated analysis as HTML, PDF, LaTeX, etc.
│   └── figures        <- Generated graphics and figures to be used in reporting
│
├── requirements.txt   <- The requirements file for reproducing the analysis environment, e.g.
│                         generated with `pip freeze > requirements.txt`
│
├── setup.py           <- makes project pip installable (pip install -e .) so src can be imported
├── src                <- Source code for use in this project.
│   ├── __init__.py    <- Makes src a Python module
│   │
│   ├── data           <- Scripts to download or generate data
│   │   └── make_dataset.py
│   │
│   ├── features       <- Scripts to turn raw data into features for modeling
│   │   └── build_features.py
│   │
│   ├── models         <- Scripts to train models and then use trained models to make
│   │   │                 predictions
│   │   ├── predict_model.py
│   │   └── train_model.py
│   │
│   └── visualization  <- Scripts to create exploratory and results oriented visualizations
│       └── visualize.py
│
└── tox.ini            <- tox file with settings for running tox; see tox.readthedocs.io
Project based on the cookiecutter data science project template. #cookiecutterdatascience