
Our goal is to create a machine learning model that will be trained to predict whether or not a youtube video has the potential to be viral. This will be based on features which include amount of subscribers that channel has, total amount of views on the channel and video, which category the video belongs to, and total amount of likes on the video. From these features, we will have over 7,000 videos to train and test this algorithm on so the model can learn which features best predict if the video will be viral. We are basing the term viral as a video that gets over 1 million views. If the video can get over 1 million views than it will be given the value of 1 which equates to viral. If the video would get less than 1 million views then it would be given the value of 0, for not viral.
We chose 1 million views as our differentiating point of viral vs. not viral. Due to a growing number of Internet and social media users, while still a big achievement, reaching that mythical million is no longer as much of a challenge. There are simply too many videos with that many views to make them all stand out. It’s safe to assume that currently, it’s better to aim at gaining at least 1 million views to reap the benefits of going viral. If you can get 1 million views on your video that is the equivialant to about $5,000. So, to answer the question of how many views is viral - there is no simple answer here. In reality, not all viral videos are created equal, so the more views you get, the better, but for our machine learning model's sake, we chose 1 million views.
-
Zara Khan - zaraxkhan - Circle Role
-
Kevin MacDonald - macdkw89 - Triangle Role
-
Justin Tapia - justint42 - X Role
-
Snehal Desavale - SNEHALDD - Square Role
Link to Google slides presentation
-
Youtube v3 API (https://www.googleapis.com/youtube/v3)
- All data used in this project is sourced directly from the Youtube API
- API Resources used
- Channels
- Comments
- CommentThreads
- Videos
-
Dataset Category References:
- Best Youtube Channels for every category
- Using this article, we obtained each channel listed under each category for our purposes
- We opted to not use the "Yoga" category due to its similarity to the "Fitness" category.
- List of most-subscribed YouTube channels - Wikipedia
- Using this link, we sorted the table and grabbed the top 20 English Language channels by subscriber count for use in our analysis
- There are a handful of duplicate channels in this data when compared to the categorical channel list mentioned above. Our analysis will drop these to avoid duplicate entries.
- Best Youtube Channels for every category
-
Software :
- Python 3.9.12
- Scikit-learn 1.0
- Numpy 1.21.5
- pandas 1.4.2
- psycopg2-binary-2.9.5
- vaderSentiment - SentimentIntensityAnalyzer
-
Relational Database : PostgresSQL 11 connected to AWS database server.
-
Tools / Software : Tableau public, git, pgAdmin, VS Code.
Before you begin, Please ensure you have met the following requirements:
You have installed updated version of Python, VS Code, and related dependencies
You have PostgresSQL 11 installed.
You have created a database in AWS.
You have access to Tableau public.
We are using machine learning to see if we can predict whether or not a YouTube video can reach 1 million views based on its subscriber count, channel video count, the topic of the video, the length of the video, and the day of week the video was published. We are using 1 million as our numeric value of whether the video has the potential to be 'viral' or not. Below is the code we used to add the viral or not column from our dataset we created using Youtube's API.


Our machine learning question is which features, from the YouTube video itself and the YouTube channel, are most important in helping a video gain this viral view count of 1 million views.
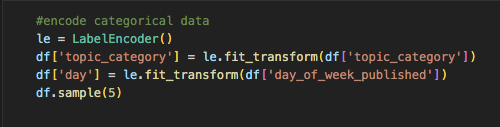
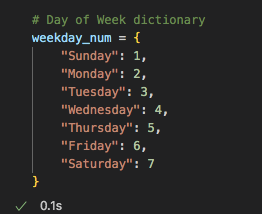
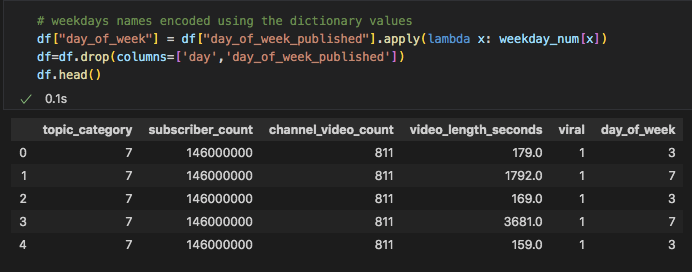
In order to begin the Machine Learning portion, we must preprocess the feature set of the data. First we encoded the categorical data. We did this for the topic category column and the day of week published column. This turned the categorical values into numerical values. However, for the day of week published column, we decided to go with custom encoding so that the days of week were not assigned random numbers, but instead 1 started with Sunday and 7 was Saturday. You can see the code we used below to encode the columns and then add custom encoding to the last column.

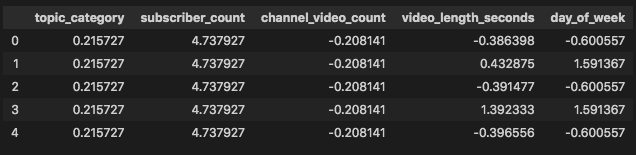
Because our columns had some very large numbers, we thought it would be best to scale each column so that every column was on the same playing field. We did this with Standard Scaler from the sklearn package. This standardizes a feature by subtracting the mean and then scaling to unit variance. Unit variance means dividing all the values by the standard deviation.

We selected the features for our machine learning by deciding what data points would effect how much a video is viewed. The first thing we thought of was the channel that posted the video. If the channel has many subscribers than the potential for the video being viewed increases. This can be affected by the amount of videos on their channel. We assumed that the more videos a channel posts, there is a potential that they one of those videos will get many views, so we included that in our machine learning model to test if this was true. FInally, from the channel data we chose topic category as a feature, as well. This would help us analyze whether or not certain topics attract more attention than others and if it was a large enough variable to affect the views a video gets. We did not want to include the channel's total view count as that would skew the data. We are not only trying to decide if channels with already a large following can reach 1 million views, but also if videos that are random can also reach this threshold.
The video data itself also seemed like a legitiment feature to include. How long the video was could have an affect of whether or not people click on the video to view. What day of the week the video was published was also a feature point we were curious about. We wanted to know if the day it was published could affect the amount of views a video gets. However, these were the only two features we chose from the video data. The amount of comments a video is getting and the like count on a video can be a predictor of whether or not the video will gain attraction, but these features occur after a video has already been posted and gets views. We did not include these as our features because we felt as though it may mess up the features importance and predicting skills of the machine learning model. If the video gets many comments and likes, the machine learning model is going to skew that way in terms that it will get many views and therefore do not become good measurements for a viral video.
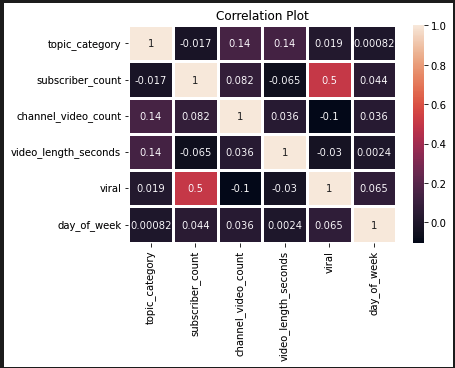
After selecting our features, we did a quick correlation matrix to see how our variables correlate with eachother. We did not want each variable to be highly correlated with one another because that leads to multicollinearity, where it becomes a problem because our independent variables should be independent of one another. If the degree of correlation is too high, it can cause problems when we run our machine learning model. As we can see below, our features are not highly correlated with eachother which makes proceeding with the machine learning model viable.
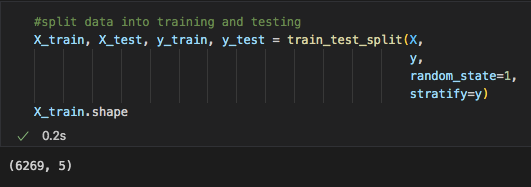
We split the data using sklearn's train_test_split function. This split our data as the default 80% for training and 20% for testing.
We used this split the first time around for our machine learning portion, before we remebered that our data might be imbalanced. So with the value count function, we checked how many of the rows were given the 1 for 'viral' and how many were given the 0 for 'not viral' and this is what was shown:
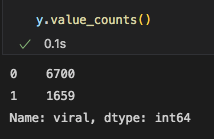
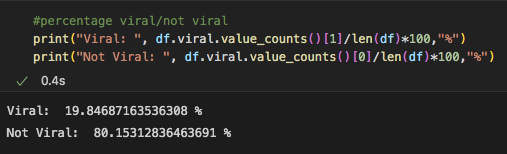
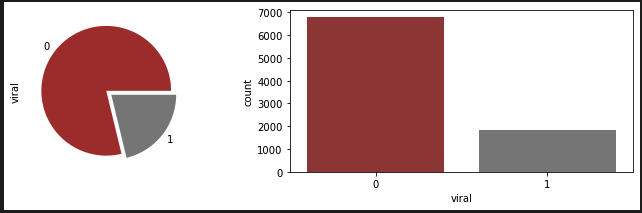
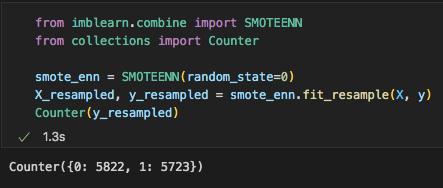
Our data was very imbalanced and we needed to use a function that would balance this data. Our instructor suggested we use SMOTEENN as it does both undersampling and oversampling at the same time. After resampling our data, we rechecked the y values and the numbers we much more balanced than before.
Our group choice 3 different machine learning models for our dataset. We started off with the most obvious choice for binary classification which was the Logistic Regression Model. It is an easy and simple model to use which will get the job done. However, this model is prone to overfitting on the training data which is something we kept in mind when navigating this model.
The next model we chose was the Random Forest Model. It was a little slower than the Logistic Regression Model whne we used it to train our data, but was the most effective with the best accuracy, presicion, and recall score. We used this model because it is known for both regression and classification, while also preventing overfitting. Even though it takes a little longer, it seemed to be the best at getting the job done with the best scores.
The last model we used was Adaboost. This was because we wanted to see if this model would be able to do a better job than the Random Forest Model. It did better than the Logistic Regression Model, however it took a longer time than any of the models to train and since our model has a lot of outliars, it was not the best fit for our dataset. We considered it beacause it is referred to as the best classifier, but due to the outliars in our model, it was not for our dataset.
Random Forest did the best job in processing our features and performing on our testing data.
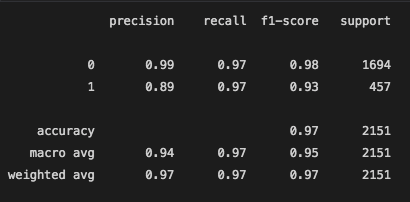
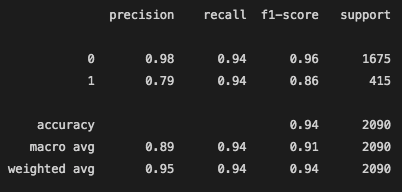
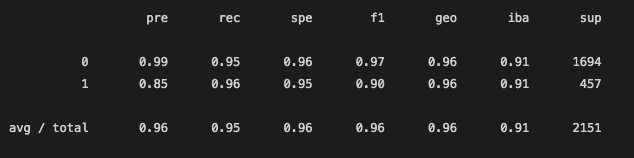
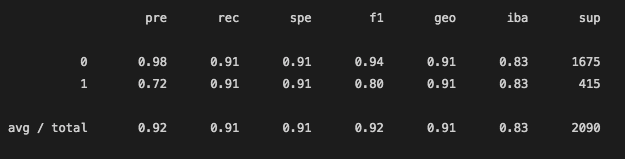
The biggest change we made to our model was when we decided to change our features. The first time we trained our models, we had much more features, including channel's view counts, video's comment counts, and video's like count. We later realized that this was skewing our machine learning data as it was really focusing on the like count of the video to determine if the video will go viral. We realized that if we include these features, our machine learning model will overfit and focus too much on criterias that are usually determine after a video already has many views. Therefore, it would not be accurate to include features that occur due to many views as opposed to what features cause the views. This showed a great change in our Classification Reports, especially when it came to the precision of our models. Although our models got a lower accuracy and precision score, it made our model make more sense to what we were trying to answer.
The model was retrained using the fit function included in all 3 libraries of our machine learning models. We simply cleaned up our table to include the features we thought were better fit for this analysis and refit our models.
Below are the classification reports and the changes that occured due to the new feature selection.
Before better Feature Selection:
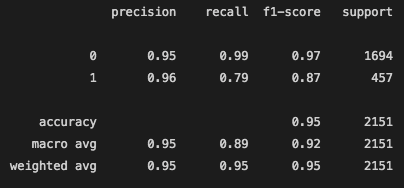
After Feature Selection:
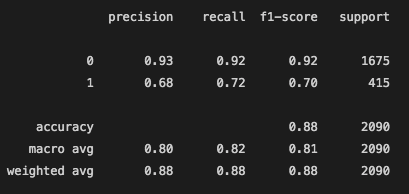
Before better Feature Selection:
After Feature Selection:
Before better Feature Selection:
After Feature Selection:
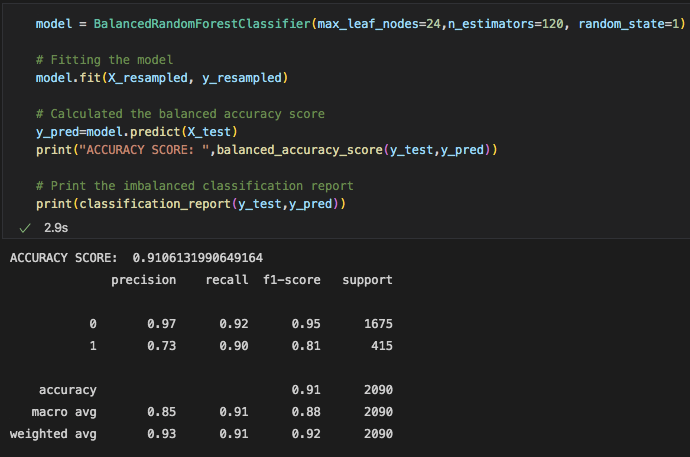
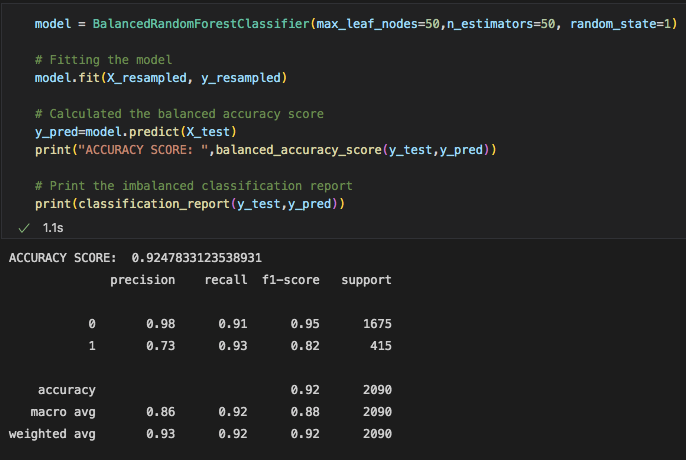
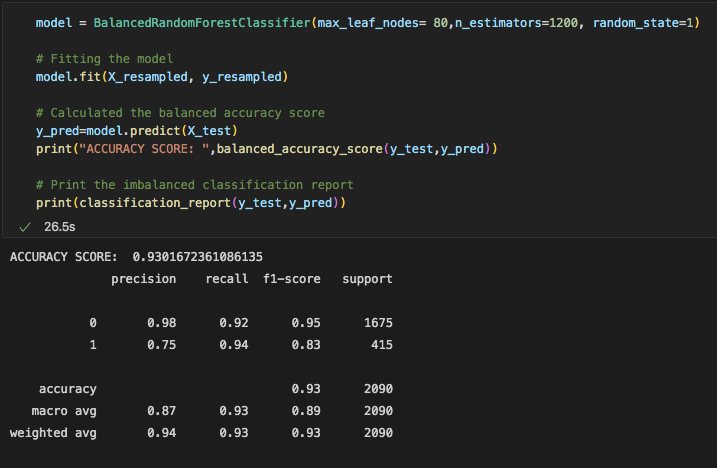
Since our RandomForest model gave us the best results, we tried a couple times to make changes to the amount of nodes and trees in order to give us a better accuracy score. However, it seems like our first attempt at the default setting was the best model we could use.
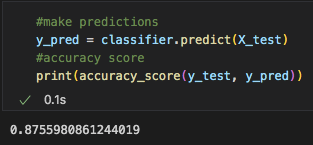
Below are the accuracy scores for all 3 models we used, along with the confusion matrix and classification report with an explanation of what these numbers mean;
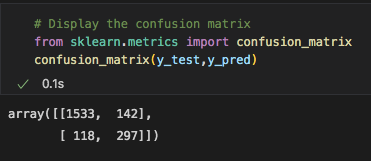
The Accuracy Score of this model was fair. at 87.6%, it was able to categorize whether a video was going to reach that 1 million mark most of the time.
We can see from the confusion matrix, that model confused 142 videos as viral when they were actually below the 1 million mark, these are the false positves. The model predicted 118 videos as not viral even though they actually did gain more than 1 million views, these are the false negatives.
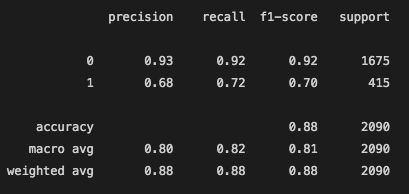
The precision and recall for when the model was to predict a video under 1 million views was great. However, when it came to the precision and recall of the viral videos, it has a little more difficulty, as we saw from the confusion matrix. Precision scores share what percent of predictions were correct. So, looking at the classification report, only 68% of the true positives were labeled correctly. The other 32% of videos that were labeled as viral were actually not viral. This is a large chunk of videos falsely labeled. Recall shares what percent of viral videos did the model catch. From this model as we can see below, logistic regression model was able to correctly identify 72% of the viral instances as viral and labeled the rest as not viral, even though they were.
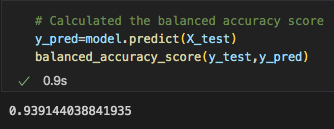
This model had the best accuracy score at 93.9%. This model was the best at predicting which video goes in the viral vs non-viral category.
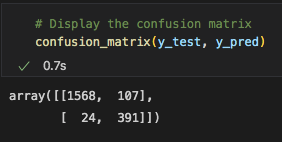
We can see from this model's confusion matrix that 107 videos that were labeled as viral were actually below the 1 million views mark, the false positives. Furthermore, only 24 videos that were actually above the 1 million mark were labeled as not viral. This is the false negatives number.
The recall for this model was much better than the last. 94% of videos that were viral were labeled correctly as viral. The precision is still a little low, however, it is the best of what all 3 models could do. The models are all having alittle trouble labeling a video as viral, when infact it did not actually gain over 1 million views.
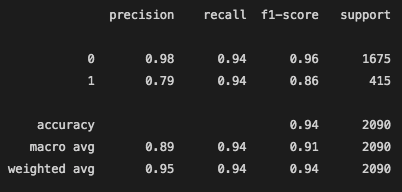
For our last model, the accuracy score was at 90.9%, which is not bad at all but definently not the best.
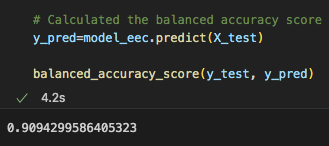
This confusion matrix showed that 146 videos that were not viral were labeled as viral and those are the false positives. Only 39 videos that were actually viral were labeled as not viral, which is not too bad. These are the false negatives.
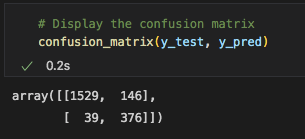
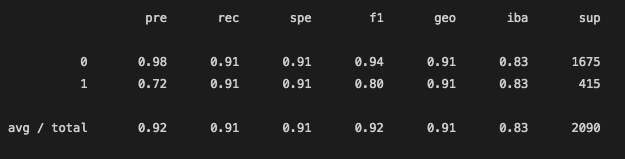
From the Classification Report, we can see that the recall ability was pretty high. For the recall score of the 1 label, the videos that were actually viral and labeled as not viral were not too many. However, the precision of this model for the viral videos was still pretty low as seen with the other 2 models. 72% of videos that were labeled as viral were correctly labeled, however, the other 28% of videos that were labeled as viral but were not actually above the 1 million view mark.
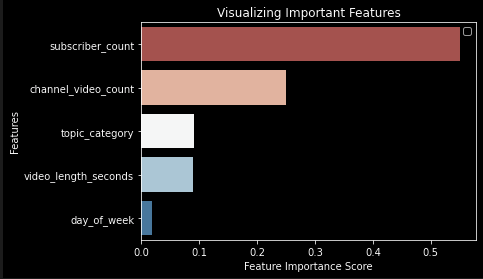
The RandomForest model did the best job in training and learning which features make for a viral video. Giving us the best accuracy score at 93%, as well as the highest pression and recall score, the model is the best at being able to predict with the features which video will gain 1 million views. And with one simple function, we were able to categorize which features were the most important when making it's calculations. So going back to our original question, which YouTube video and channel metrics play the biggest role in creating a video that will gain the largest amount of views?, below the bar graph answers our question. Subscriber count and the amount of videos seem to have the strongest correlation.
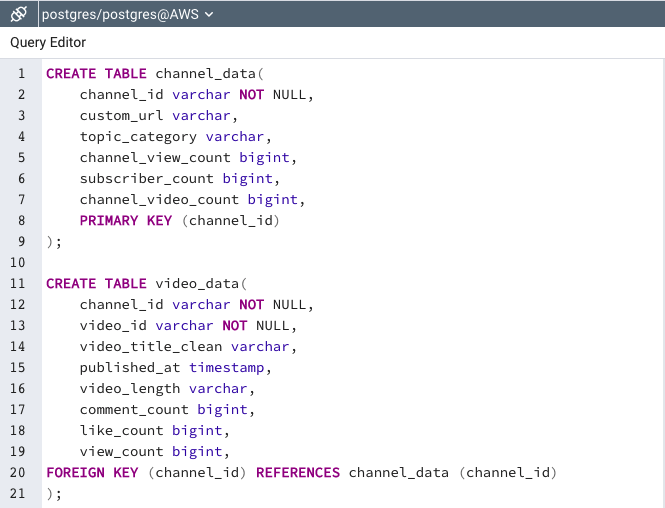
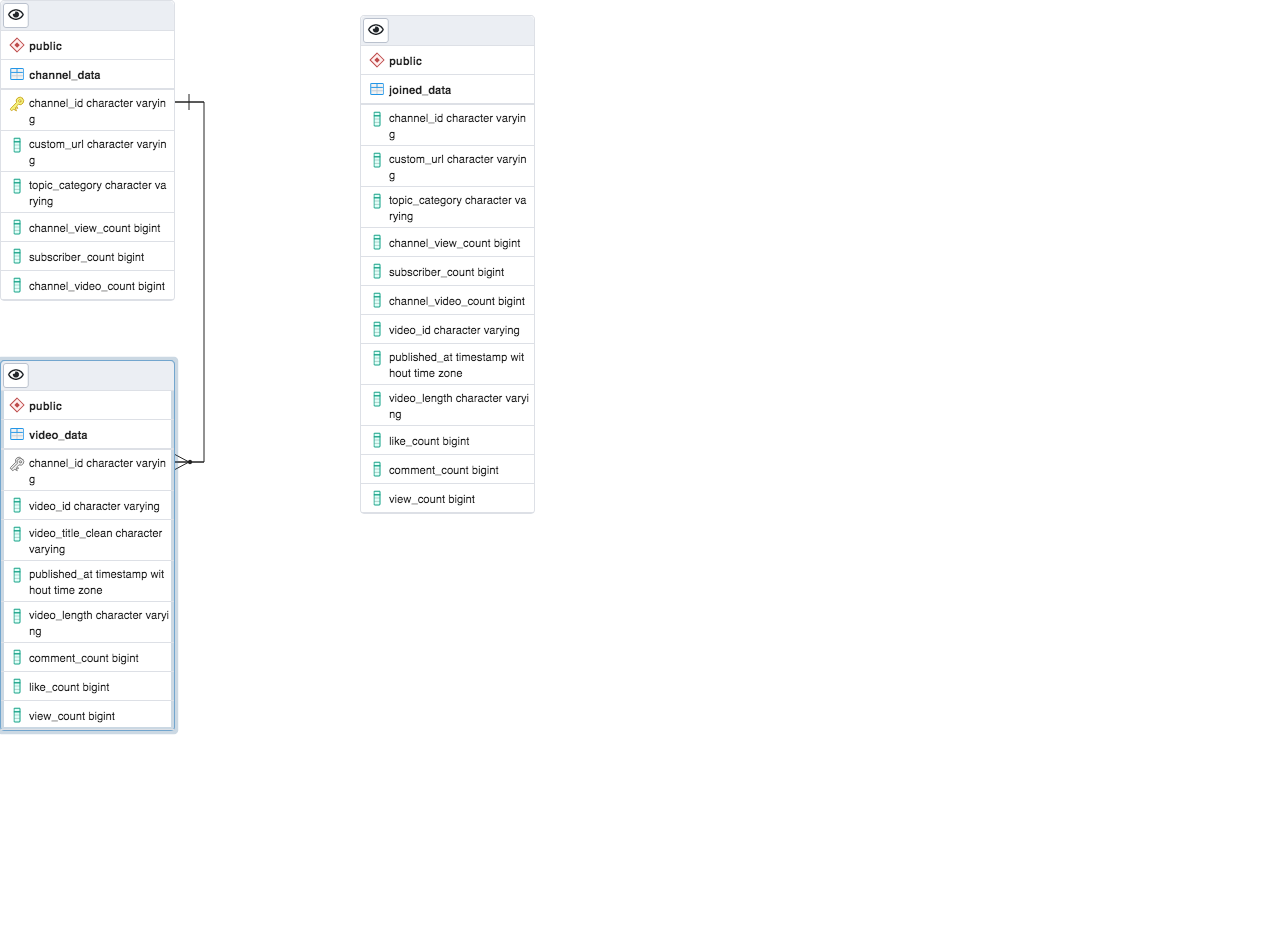
We created a database in Amazon Web Services and connected the host,database, user, and password onto a new server on PostgreSQL. We created two tables, one which contains information regarding the 178 channel data and the other which contains information about the 50 videos we gathered from each channel, the video data. We joined these files on the primary key which is the channel_id.
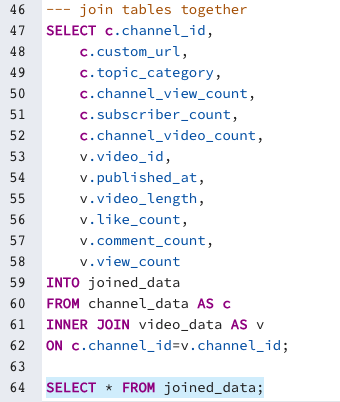
This joined file stores all the information we will need in order to begin to train our machine learning model and create the best visualizations possible.
Here is the ERD visual which makes the connection of both tables that we joined together to create our final dataframe.

As shown in this file, we will be using psycopg to connect our database that is currently stored in the cloud, to our python file in order to do our machine learning model.
We will add visualizations of:
- Total number of subscribers of the channel,
- Total number of views on the video,
- Total number of likes on the video.
- Total length of the video.
- Ratio of number of subscribers to number of views.
Interactive element(s):
- Dropdown menu which will list names of all the categories. Once you choose the category, dashboard will show above charts and information of videos.
- Animation which shows which category was most viewed in the particular year.
If you want to contact us, you can reach us at
zaraxkhan - zxkhan.99@gmail.com
macdkw89 - macdkw@gmail.com
justint42 - tapiajustin42@gmail.com
SNEHALDD - snehaldesavle3@gmail.com