Module 3 challenge
In this work, I created a Python script that analyzes the financial records of my company, PyBank.
I used the financial data found in budget_data.csv , which contained two columns: Date and Profit/Losses.
The Python script analyzed the records to find the following:
-
The total number of months included in the dataset
-
The net total amount of "Profit/Losses" over the entire period
-
The changes in "Profit/Losses" over the entire period, and then the average of those changes
-
The greatest increase in profits (date and amount) over the entire period
-
The greatest decrease in profits (date and amount) over the entire period
Finacial Analysis
----------------------------
Total Months:  86
Total:  $22564198
Average Change: $-8311.11
Greatest Increase in Profits:  Aug-16  ($1862002)
Greatest Decrease in Losses:   Feb-14  ($-1825558)
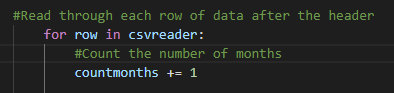
I used the following code to count the number of rows in the data set (skipping the header row) to find the total number of months.
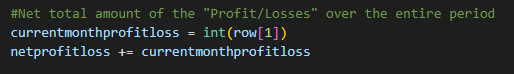
To find the net total amount of Profit/Losses, the code needed to loop through the rows and add up all the amounts in the Profit/Losses column (row 1).
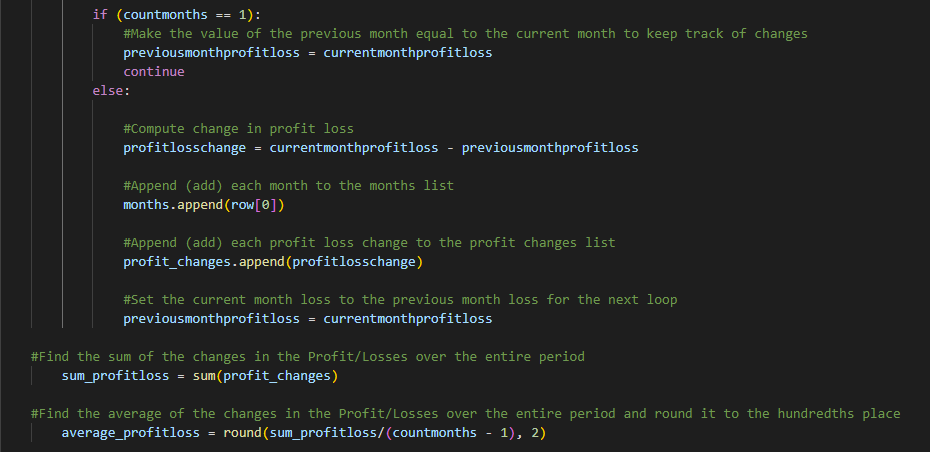
Finding the average change in Profit/Losses over the entire period required looping through all the rows and subtracting the current months profit from the previous months profit and keeping track of those numbers in a list. Those values would need to be reset after each loop to get the new amount. Those profit changes would then need to be added together and divided by the number of months. However, one month would need to be subtracted from the total months given that the first month of the data set would not have a previous month to subtract from.
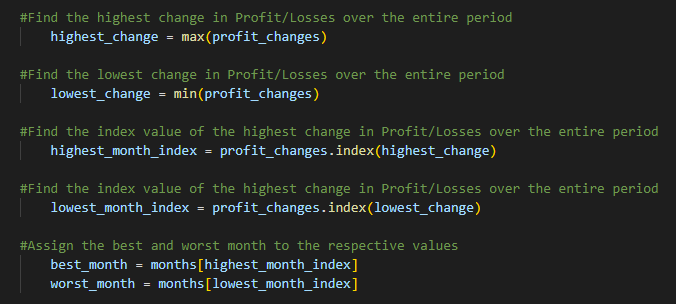
Finally, I used the min and max functions to find the lowest and highest profit changes from the data set. I also used the index function to retrieve the given date that went with the lowest and highest profit change.
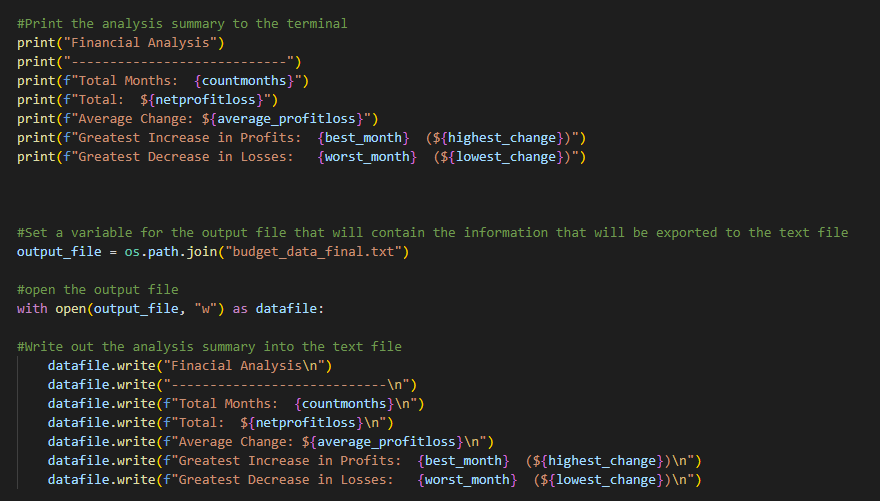
This information was then printed to the terminal and exported to a text file.
In this work, I created a Python script for analyzing the votes of election results.
I used the poll data collected and stored in election_data.csv, which was composed of three columns: Voter ID, County and Candidate.
The Python script analyzed the votes to find the following:
-
The total number of votes cast
-
A complete list of candidates who received votes
-
The percentage of votes each candidate won
-
The total number of votes each candidate won
-
The winner of the election based on popular vote.
Election Results
-------------------------
Total Votes: 369,711
-------------------------
Charles Casper Stockham: 23.0% (85,213)
Diana DeGette: 73.8% (272,892)
Raymon Anthony Doane: 3.1% (11,606)
-------------------------
Winner: Diana DeGette
-------------------------
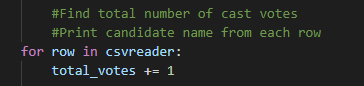
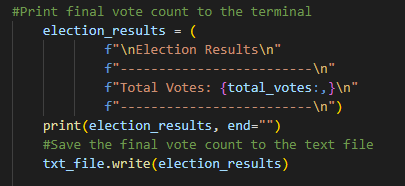
I used the following code to loop through the rows and add the total number of votes in the election.
This was then printed to the terminal and exported to a text file.
I created a list to hold the names of the candidates that received votes in the election. The code looped through the candidate row and added the various names of the candidates to the list.
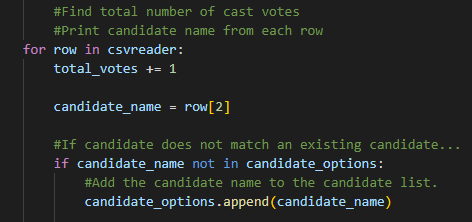
I also began tracking the candidate vote count to be held in a dictionary. This information would be used later to find the total number of votes that each candidate received, as well as who won the most votes (popular vote).
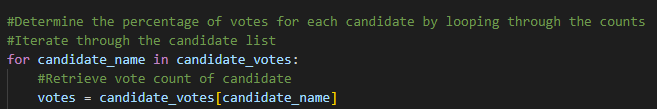
To find the percentage of votes that each candidate received required dividing the total number of votes by the votes for each candidate (that was held in the dictionary) and multiplying the answer by 100.
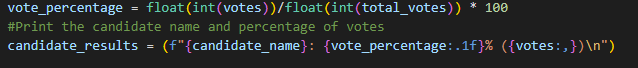
This information was then printed to the terminal and exported to the text file.
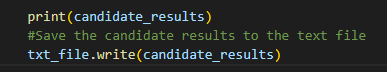
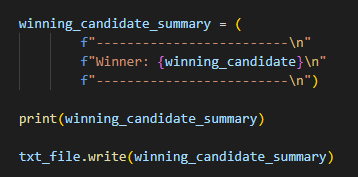
I needed to use the following code to determine the winning vote count and which candidate won the election.
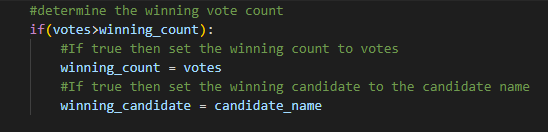
The winners name was then printed to the terminal and exported to the text file.