Free, browser-based portfolio analysis for algorithmic futures traders.
Upload your NinjaTrader or Tradovate trade exports, compare strategies side-by-side, and find the optimal allocation mix — all without sending your data anywhere.
Live tool: https://algoscopepro.netlify.app/ (or open index.html directly in any browser)
Ready-made NinjaTrader strategies: ninjatraderalgos.com
NinjaTrader is excellent for developing and analysing individual algorithms. You can backtest a single strategy, review its performance report, tweak parameters, and iterate. That part works well.
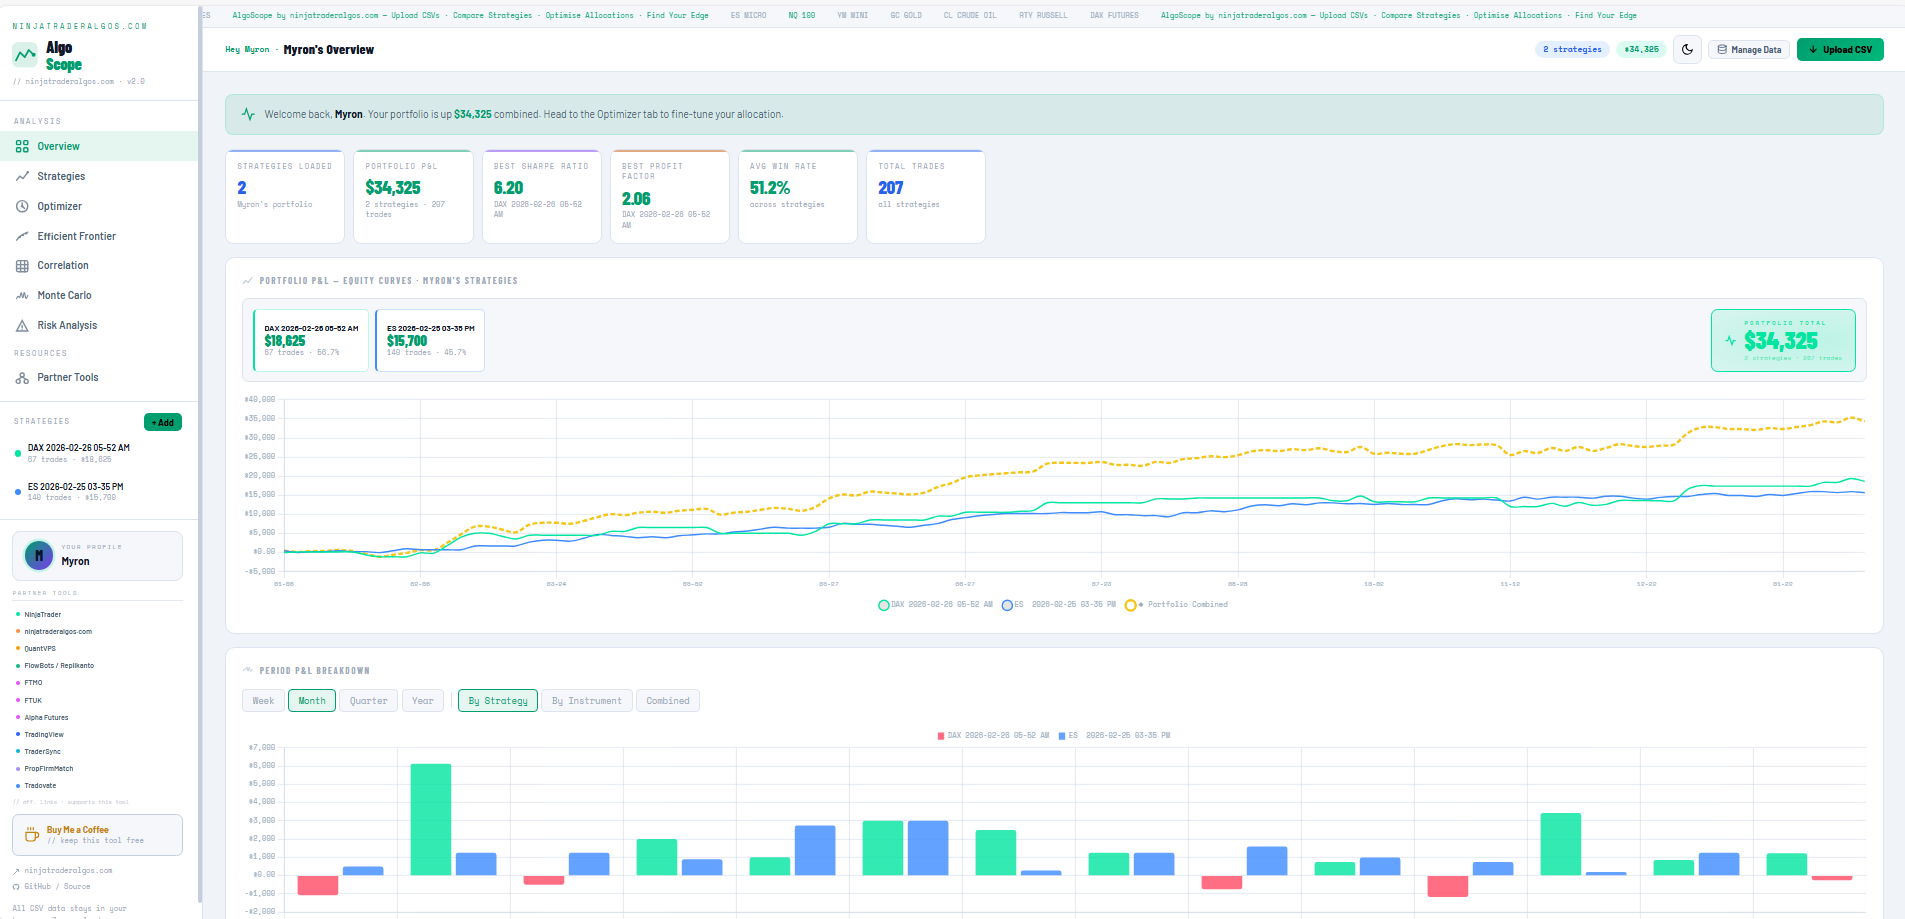
But the moment you're running two or more algos simultaneously — which most serious automated traders eventually do — NinjaTrader gives you no native way to answer the questions that actually matter at the portfolio level: How are these strategies interacting? Are they genuinely diversified, or are they all losing on the same days? If I have $50k to allocate, how much should go behind each one? What does my combined equity curve look like, and how bad could a drawdown get across the whole portfolio?
That gap is what AlgoScope was built to fill. It takes the trade exports you already have from NinjaTrader and lifts the analysis up to the portfolio level: correlations, combined drawdowns, optimal allocation, stress testing. Everything NinjaTrader's built-in reporting doesn't cover when you're running multiple strategies together.
Most traders run multiple automated strategies and have no way to know how they interact with each other — or how much capital to put behind each one. This tool answers that question.
Load your trade history CSVs, and the optimizer tells you:
- Which strategies are genuinely adding value versus overlapping each other
- What the best capital split would be according to 10 different mathematical methods
- How your portfolio would have performed in the worst conditions (Monte Carlo stress testing)
- Whether your chosen allocation actually holds up on data the optimizer hasn't seen (Walk-Forward Validation)
Everything runs in your browser. No account needed, no data sent anywhere, no cloud, no sign-up.
- Open NinjaTrader 8
- Go to Account Performance
- Click the Trades tab (important — not Executions or Orders)
- Right-click anywhere in the table → Export to CSV
- Log in to Tradovate
- Go to Account → History
- Click the Orders tab (important — not Fills or Positions)
- Click Export → CSV
The tool auto-detects both formats. It also accepts NinjaTrader Performance Reports.
Every uploaded strategy gets a full performance breakdown across returns, risk, drawdown, tail risk, and positioning.
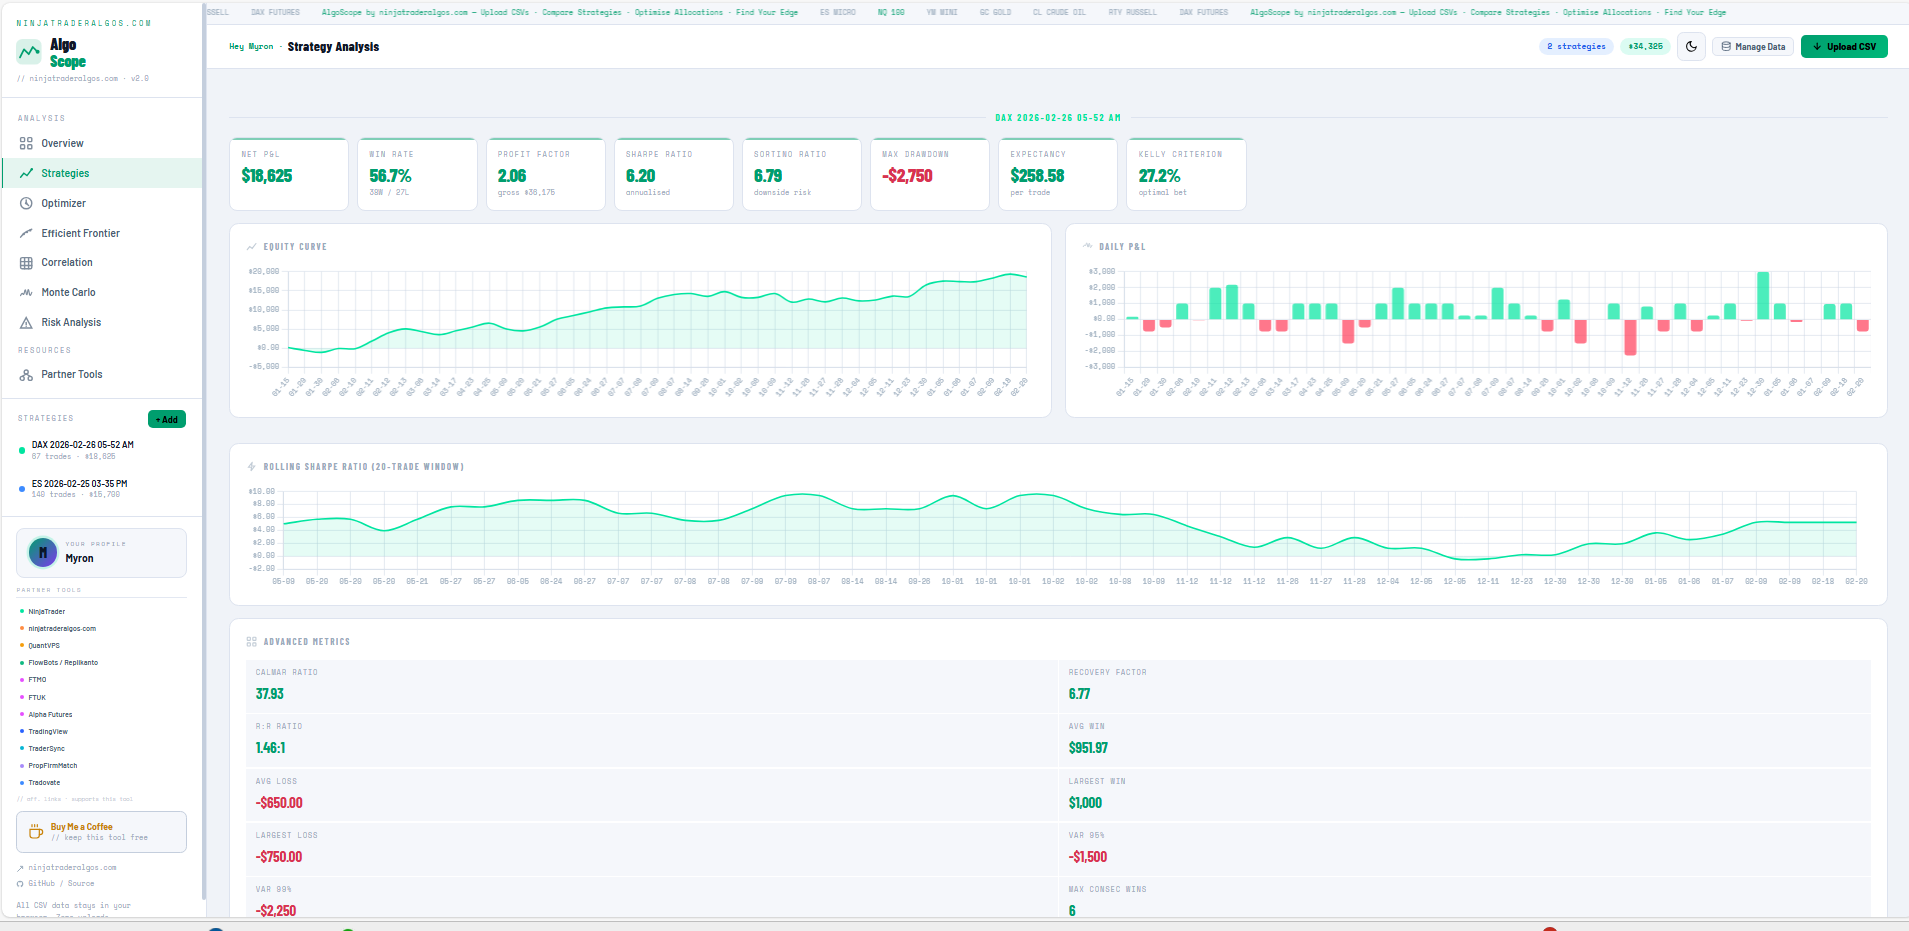
- Returns: Total P&L, daily breakdown, win rate, average win/loss, profit factor
- Risk-adjusted: Sharpe ratio, Sortino ratio, Calmar ratio
- Drawdown: Max drawdown, max drawdown %, recovery factor
- Tail risk: Value at Risk (95% and 99%), CVaR / Expected Shortfall
- Positioning: Kelly Criterion (full, half, quarter), expectancy per trade
- Distribution: Skewness, kurtosis, Z-score, win/loss streaks
- Time breakdown: Performance by hour of day, day of week, monthly calendar heatmap
The optimizer runs all 10 methods simultaneously and shows the result of each in a side-by-side comparison table. Click any row to instantly apply that allocation.
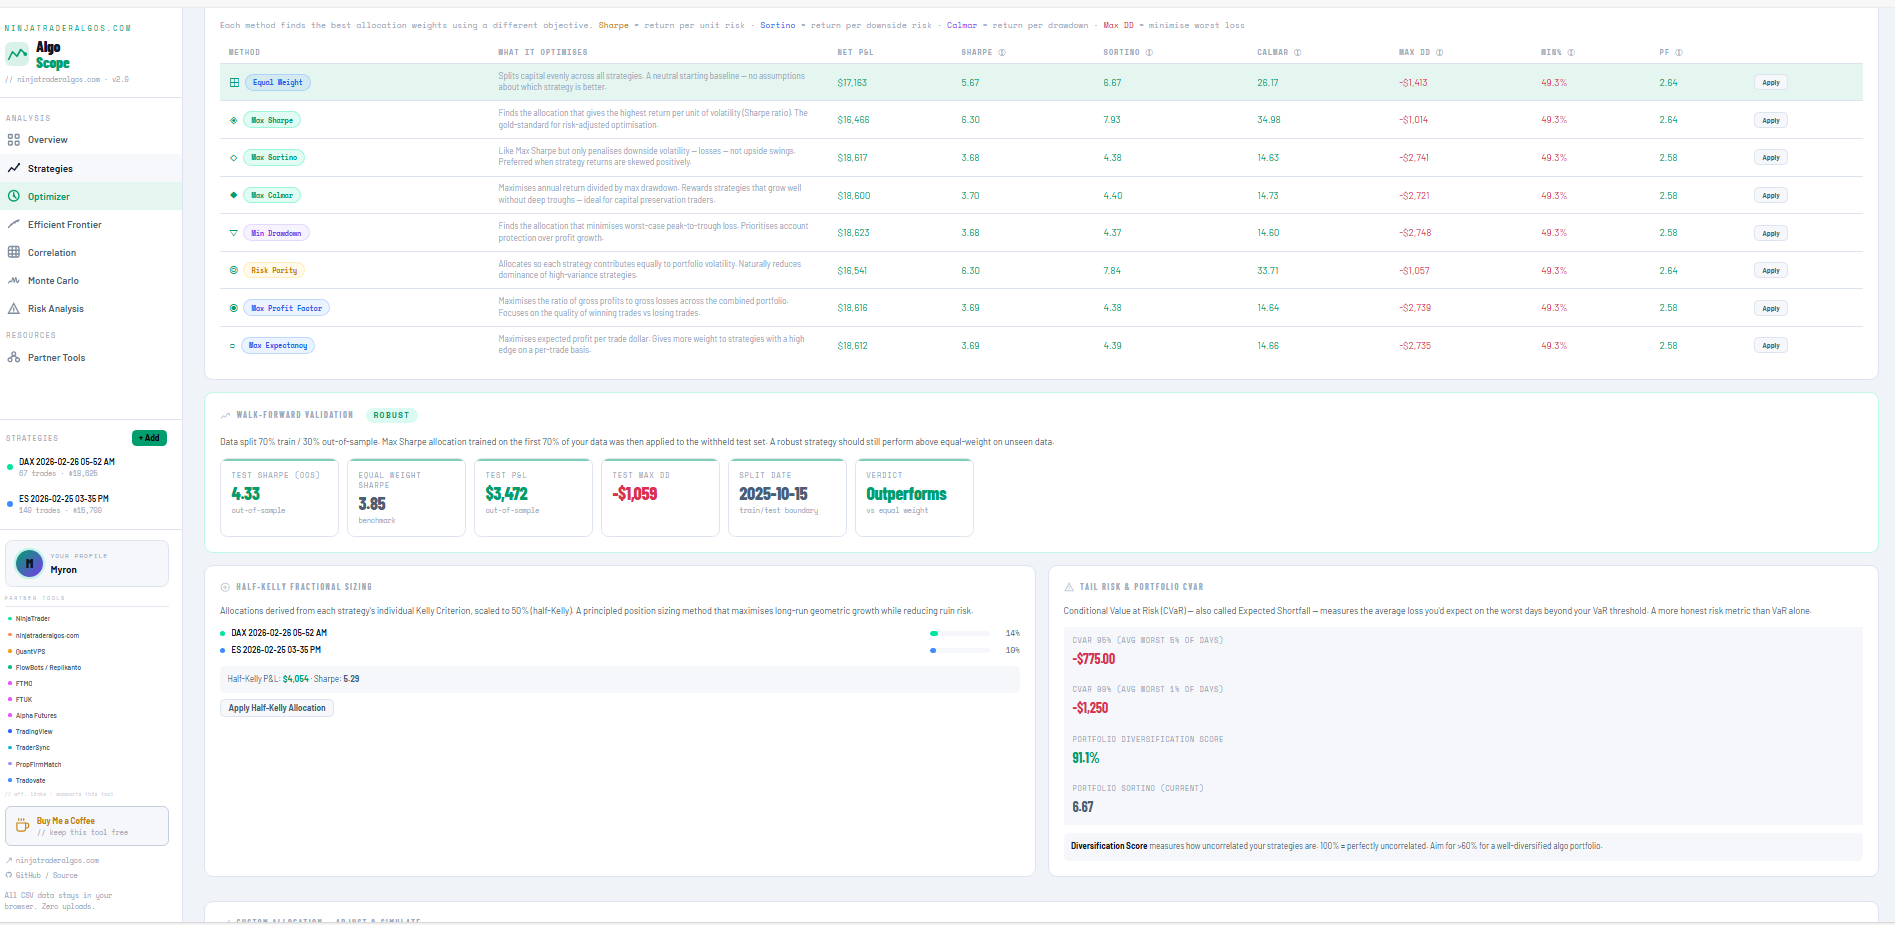
| Method | What It Finds |
|---|---|
| Max Sharpe | Highest return per unit of risk |
| Max Sortino | Highest return relative to downside volatility only |
| Max Calmar | Best return-to-drawdown ratio |
| Min Drawdown | Allocation with the smallest worst-case loss |
| Risk Parity | Each strategy contributes equally to total portfolio volatility |
| Half-Kelly Sizing | Capital allocation based on each strategy's Kelly Criterion, scaled to 50% |
| Max Expectancy | Highest expected profit per trade |
| Max Profit Factor | Best ratio of gross profits to gross losses |
| Equal Weight | Neutral starting baseline — same size for everything |
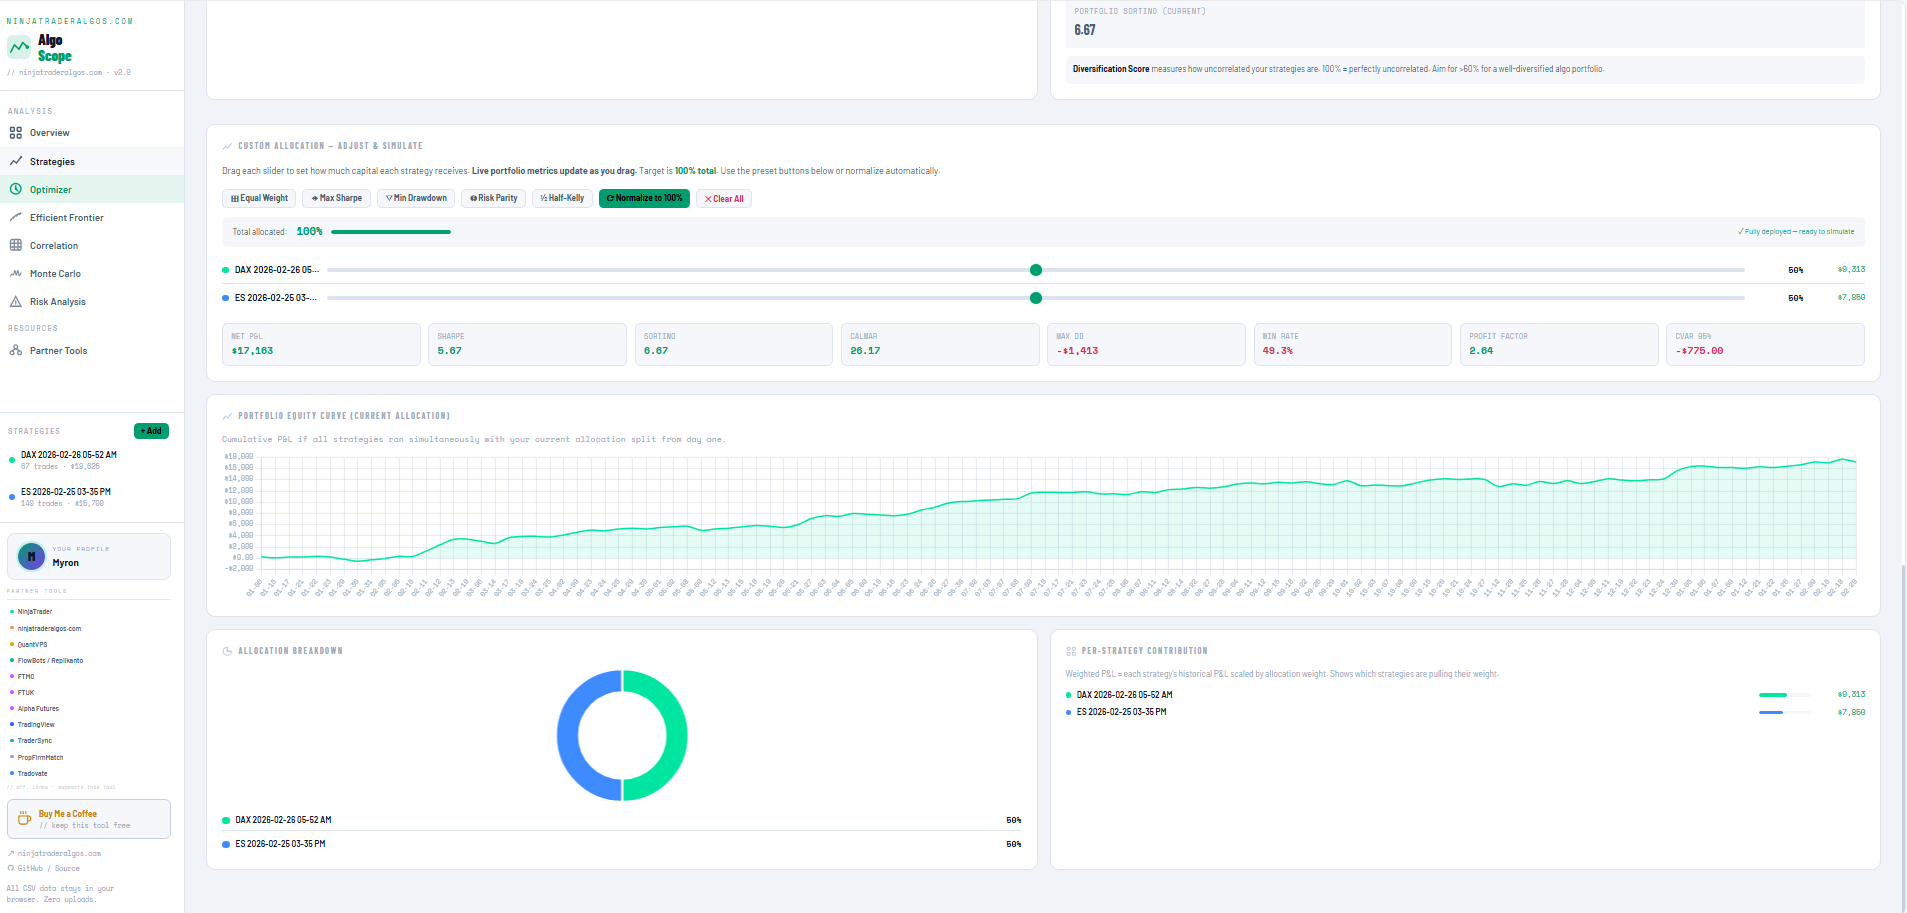
Use the interactive sliders to manually fine-tune your allocation and watch portfolio metrics update in real time.
The most important feature for avoiding overfitting.
The optimizer trains on the first 70% of your data, then tests the resulting allocation on the remaining 30% — data it has never seen. If the Max Sharpe allocation still outperforms equal-weight on the test set, that's a signal the allocation is robust, not just fitted to historical patterns.
Results: Out-of-sample Sharpe, P&L, max drawdown, split date, and a clear Robust / Review verdict.
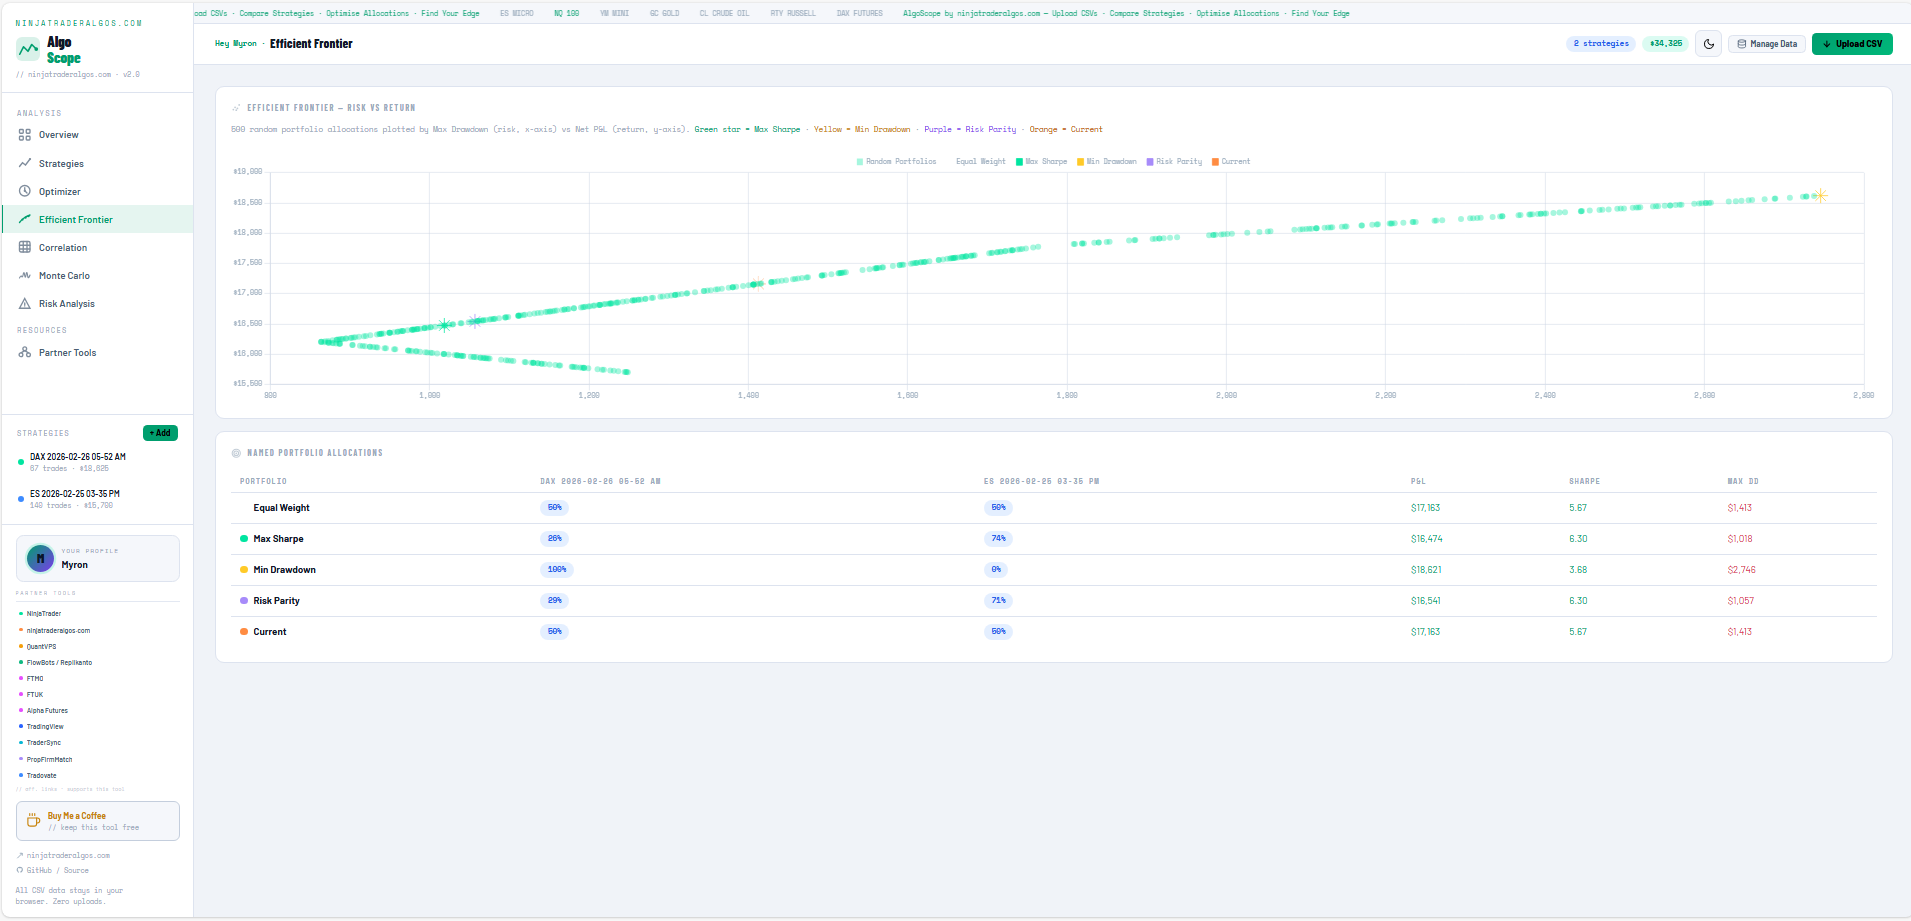
A scatter chart showing every possible combination of your strategies across all allocation ratios. The x-axis is risk, the y-axis is return. Your current allocation and optimal points are highlighted, so you can see at a glance whether you're near the theoretical best.
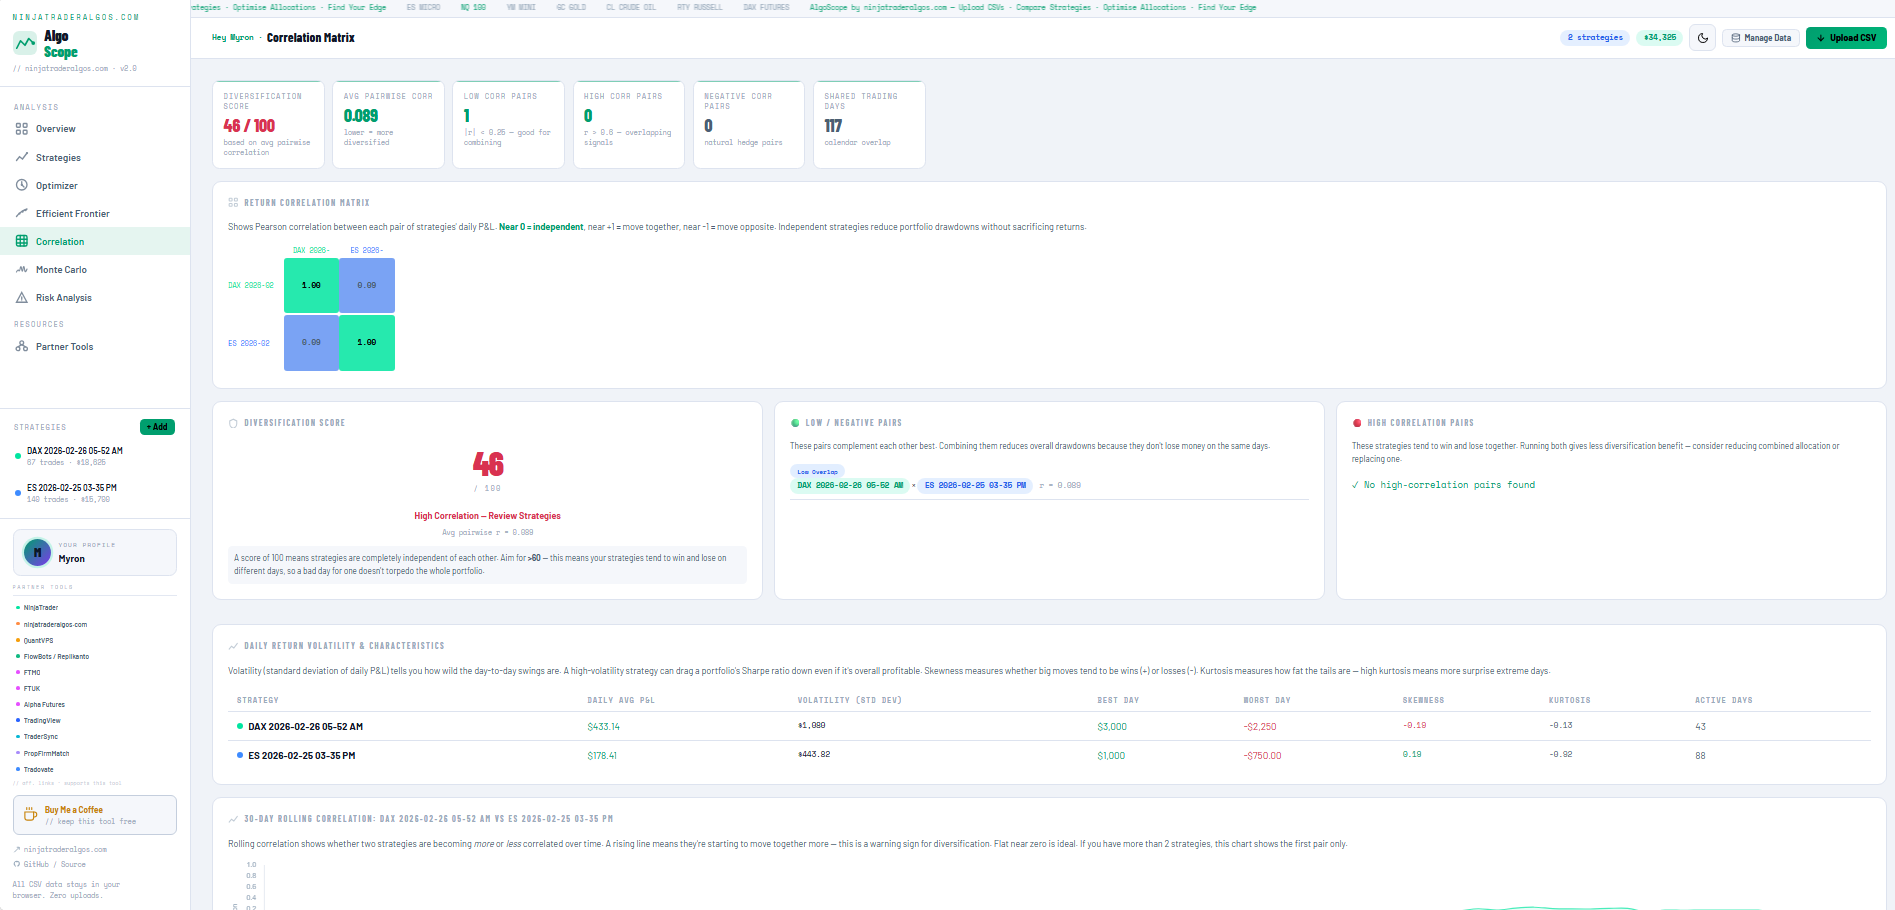
Daily correlation heatmap across all loaded strategies. Green means uncorrelated (good diversification), red means correlated (concentrated risk). Highlights the lowest-correlation pairs and flags any strategies that move too closely together.
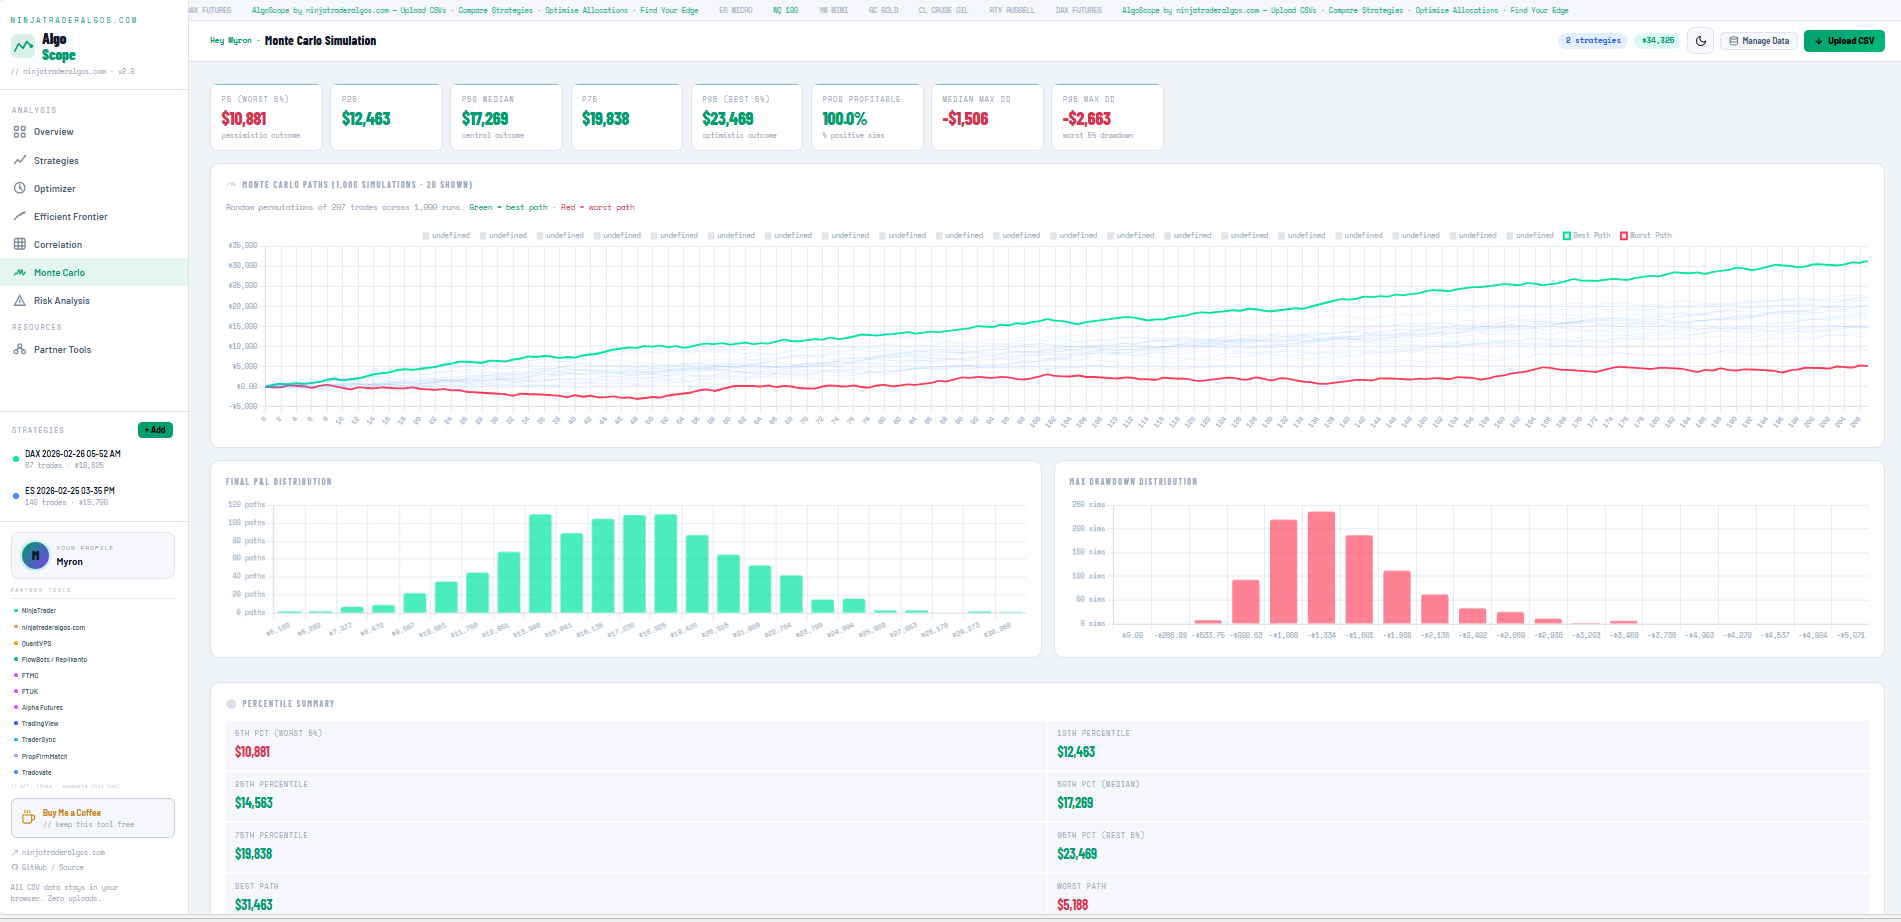
Runs 1,000 random sequences of your historical trades to stress-test the portfolio. Shows P5, P25, P50, P75, P95 outcome bands — the realistic range of outcomes, not just the average.
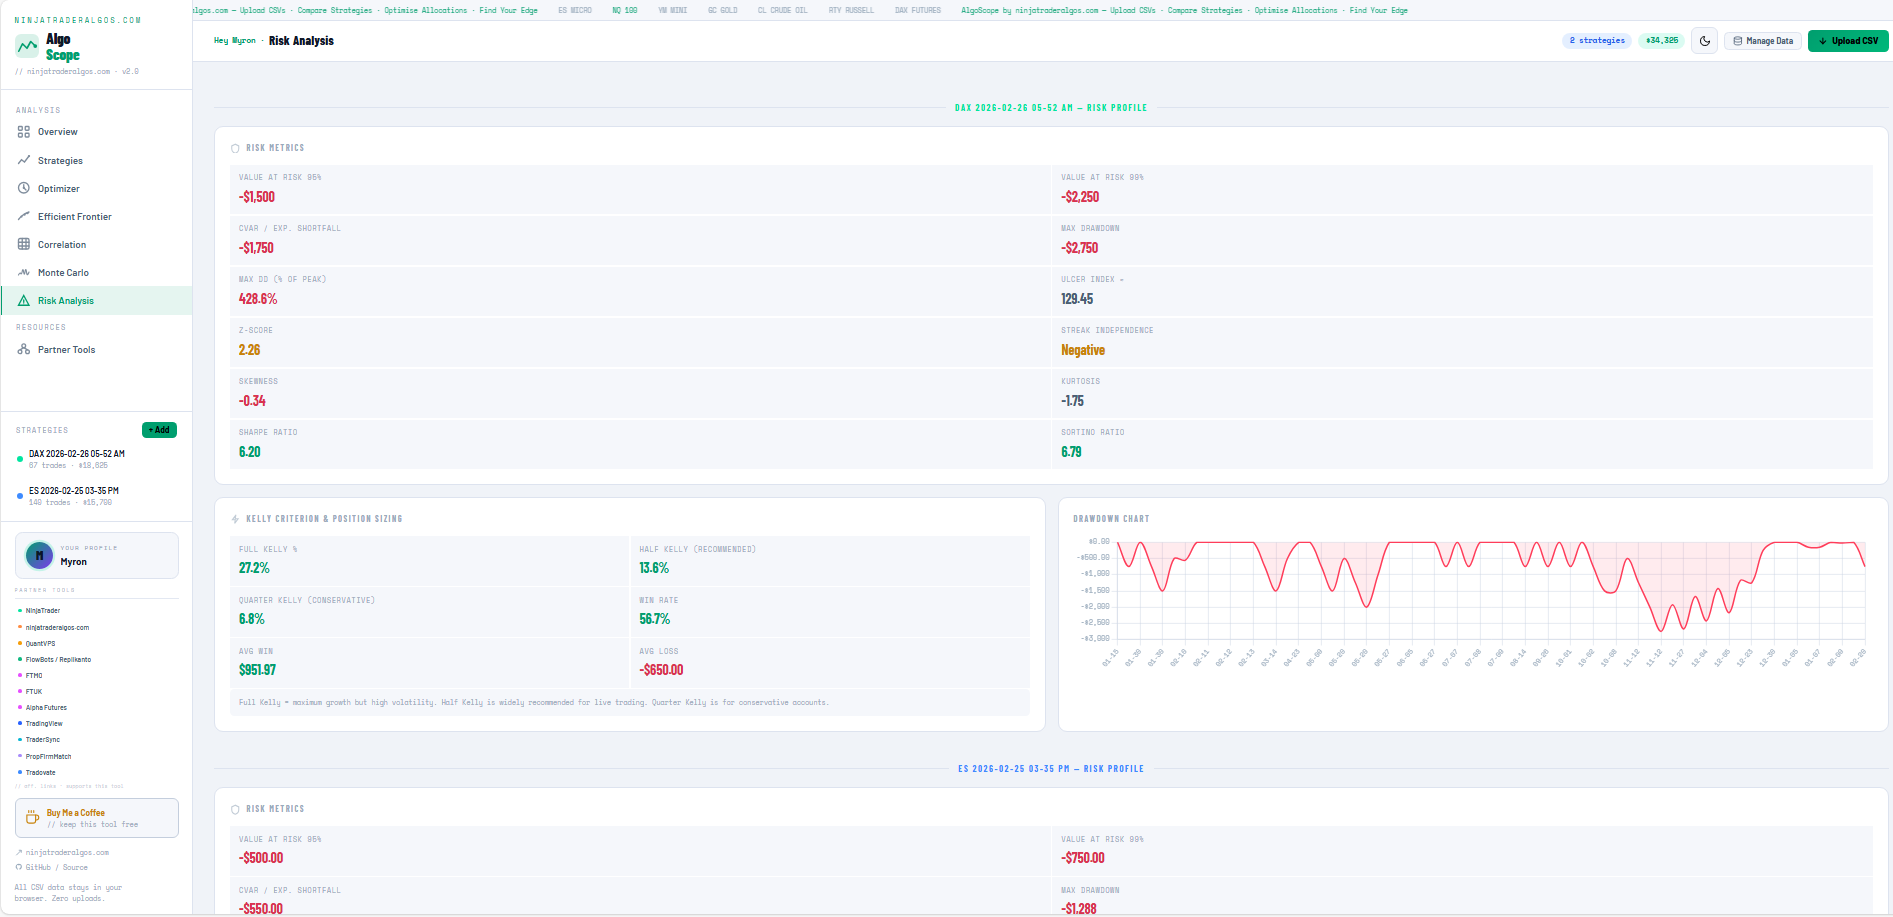
Deep dive into tail risk, Kelly sizing, and drawdown dynamics per strategy — including CVaR, VaR at 95%/99%, Z-score streak independence, and full Kelly / Half Kelly / Quarter Kelly position sizing.
Also includes:
- Diversification Score — how uncorrelated your strategies are (aim >60%)
- Tail Risk & Portfolio CVaR — on the worst 5% of trading days, what is your average loss?
- NinjaTrader algo traders running multiple strategies simultaneously
- Prop firm traders across multiple funded accounts
- Systematic traders evaluating whether their strategy mix is actually diversified
- Anyone building or scaling a multi-strategy futures portfolio
All CSV data stays in your browser. Nothing is uploaded to any server. There is no backend. No account, no login, no cloud storage. The tool works fully offline — download the HTML file and open it directly.
The Partner Tools page inside the app lists trusted tools for futures traders. Affiliate quick-links are also available in the sidebar for one-click access while you work.
| Tool | Category | Highlight |
|---|---|---|
| NinjaTrader | Trading Platform | Free futures commissions |
| ninjatraderalgos.com | Algo Strategies | Built by this team |
| QuantVPS | VPS / Infrastructure | NinjaTrader-optimised |
| FlowBots / Replikanto | Trade Copier | Multi-account copier |
| FTMO | Prop Firm | Up to 90% profit split |
| FTUK | Prop Firm | UK-based prop firm |
| Alpha Futures | Prop Firm | Futures-first prop firm |
| TradingView | Charting | Industry standard charts |
| TraderSync | Trade Journal | AI-powered journaling |
| PropFirmMatch | Prop Firm Finder | Compare all prop firms |
| Tradovate | Futures Broker | Flat-rate commissions |
| Rithmic | Data & Execution | Pro order routing |
Some links are affiliate links. Commissions help keep this tool free and ad-free. Only tools that are genuinely useful to futures traders are listed.
If you find this tool helpful, consider buying me a coffee!

Built by ninjatraderalgos.com · GitHub