Hi,
I'm troubleshooting why our production web server has high CPU usage by w3wp.exe since last release of our software.
There are more application pools (and so there are more instances of w3wp.exe) and the most relevant is process ID 9812 so I am investigating data captured from this process.
My problem is that in CallTree there is 100% in the Inc % column for the "Process64 w3wp (8912)", but when expanded, its children do not add up to 100%, and there is no obvious hot path under this node. All child nodes have some very low number in Inc % column.
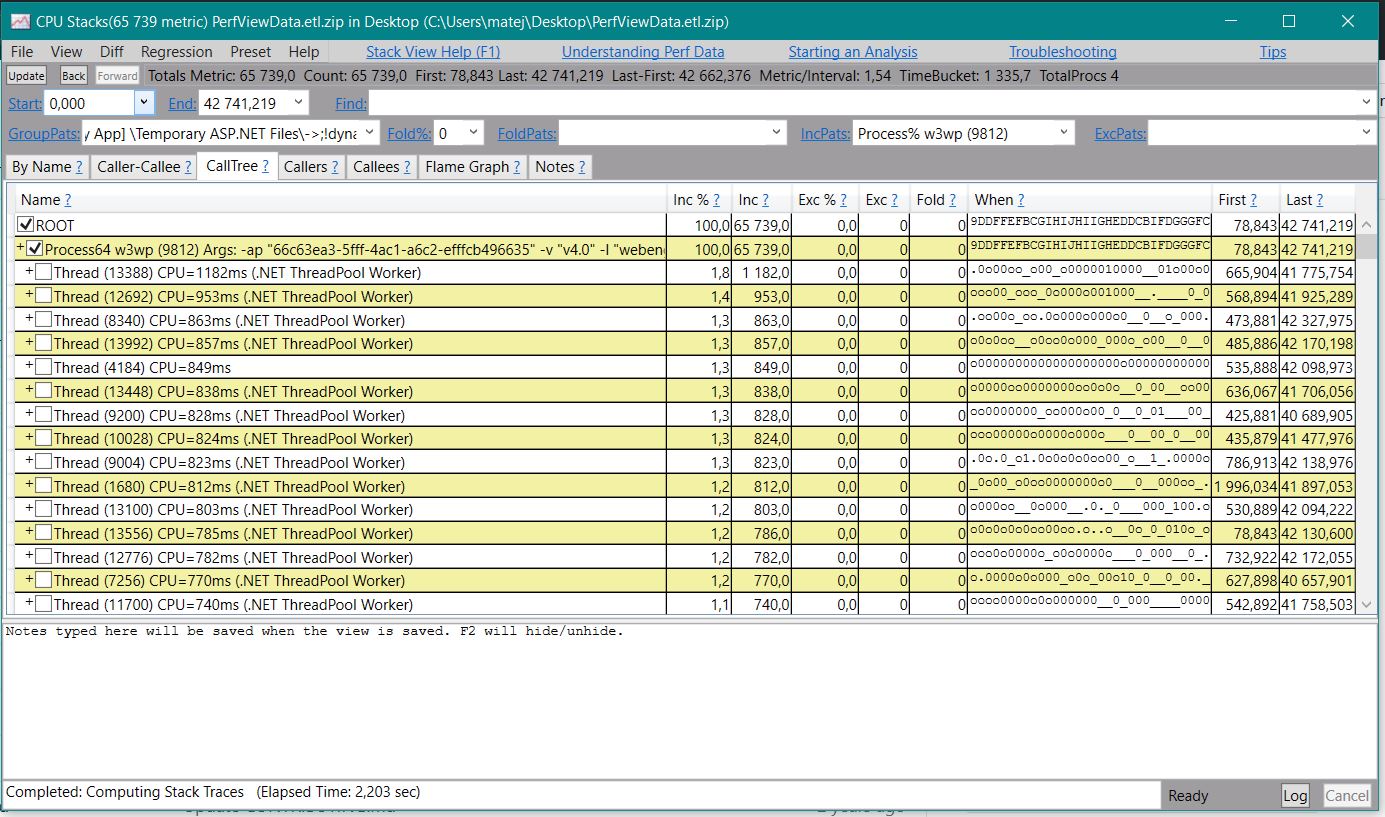
I have read the documentation, but didn't find any clue of what went wrong or how to investigate further. I have also set the Fold percentage to zero, but it didn't help. Or maybe this situation means that all that missing CPU is consumed by native call stacks? I don't know, please advise...
Hi,
I'm troubleshooting why our production web server has high CPU usage by w3wp.exe since last release of our software.
There are more application pools (and so there are more instances of w3wp.exe) and the most relevant is process ID 9812 so I am investigating data captured from this process.
My problem is that in CallTree there is 100% in the Inc % column for the "Process64 w3wp (8912)", but when expanded, its children do not add up to 100%, and there is no obvious hot path under this node. All child nodes have some very low number in Inc % column.
I have read the documentation, but didn't find any clue of what went wrong or how to investigate further. I have also set the Fold percentage to zero, but it didn't help. Or maybe this situation means that all that missing CPU is consumed by native call stacks? I don't know, please advise...