Improve hover tooltip on top-level call stack nodes #144540
Description
When the sidebar is narrow, some strings are cut off in the Call Stack panel. Top-level nodes in that tree get ellipses, but the hover tooltip on them is a different string entirely. This is an issue in the built-in JavaScript debugger, but also potentially in other debuggers, including vscode-java-debug where I initially submitted this issue.
Please allow the tooltip for those items to include the truncated text.
For instance, in vscode 1.66.0-insiders with extensions disabled, see the following screenshot:
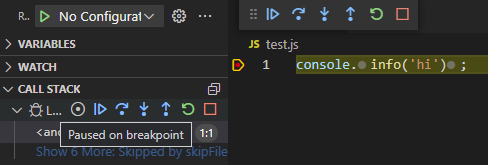
The top-level node label would be Launch Program: test.js [1724], but is truncated to L.... The hover tooltip text is just Paused on breakpoint. My request is that Launch Program: test.js should be included in the hover text somehow.
The problem is worse in the vscode-java-debug extension:
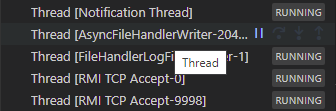
In Java there can be many threads, and the names of those threads is useful information, but the hover tooltip does not help because it merely says Thread. @testforstephen says that vscode is showing the "node kind" as the tooltip. It sounds like the vscode-java-debug extension needs better control over the tooltip text in the vscode API.