PostgreSQL revenue systems portfolio project
Normalized SaaS data model for pipeline, attribution, renewals, forecasting, and operating metrics.
Recruiter takeaway: This portfolio piece shows production-minded data modeling, revenue analytics fluency, and the ability to design the data layer underneath growth, forecast, attribution, and retention systems.
RevOps Database Lab is a PostgreSQL-first portfolio project built to model the operating data behind modern SaaS revenue systems. It covers accounts, campaigns, leads, opportunities, attribution touches, subscriptions, renewals, and content influence in a normalized schema that supports executive reporting and operator workflows.
This repo is designed to look like the database layer beneath the other systems in the portfolio: revenue ops, attribution, forecasting, customer health, partner distribution, and executive dashboards.
| Attribute | Detail |
|---|---|
| Database | PostgreSQL 16+ |
| Schema Style | 3NF-oriented normalized schema with UUID primary keys |
| Domain | B2B SaaS revenue operations |
| Coverage | Pipeline, attribution, renewals, content influence, forecast posture |
| Seed Data | 12 accounts · 8 campaigns · 24 leads · 14 opportunities · 10 subscriptions |
| Artifacts | Schema, seed data, analytics SQL, ERD, architecture notes, CI |
Revenue organizations usually report from fragmented systems:
- CRM data captures opportunity state but not full attribution context
- campaign reporting shows activity but not pipeline quality
- renewal visibility often lives in disconnected CS spreadsheets
- content influence is rarely modeled cleanly enough for operational queries
- forecasting gets distorted when pipeline, renewal, and attribution logic are not aligned
The result is noisy reporting, weak operating leverage, and low confidence in executive numbers.
This database models a practical revenue operations substrate:
- Accounts anchor company-level commercial context
- Campaigns and content assets capture demand generation inputs
- Leads represent early pipeline and acquisition motion
- Opportunities represent pipeline and sales execution
- Attribution touches make influence visible without flattening the model
- Subscriptions and renewals surface expansion, contraction, and churn exposure
The included queries translate that data into the kinds of metrics leadership teams actually use.
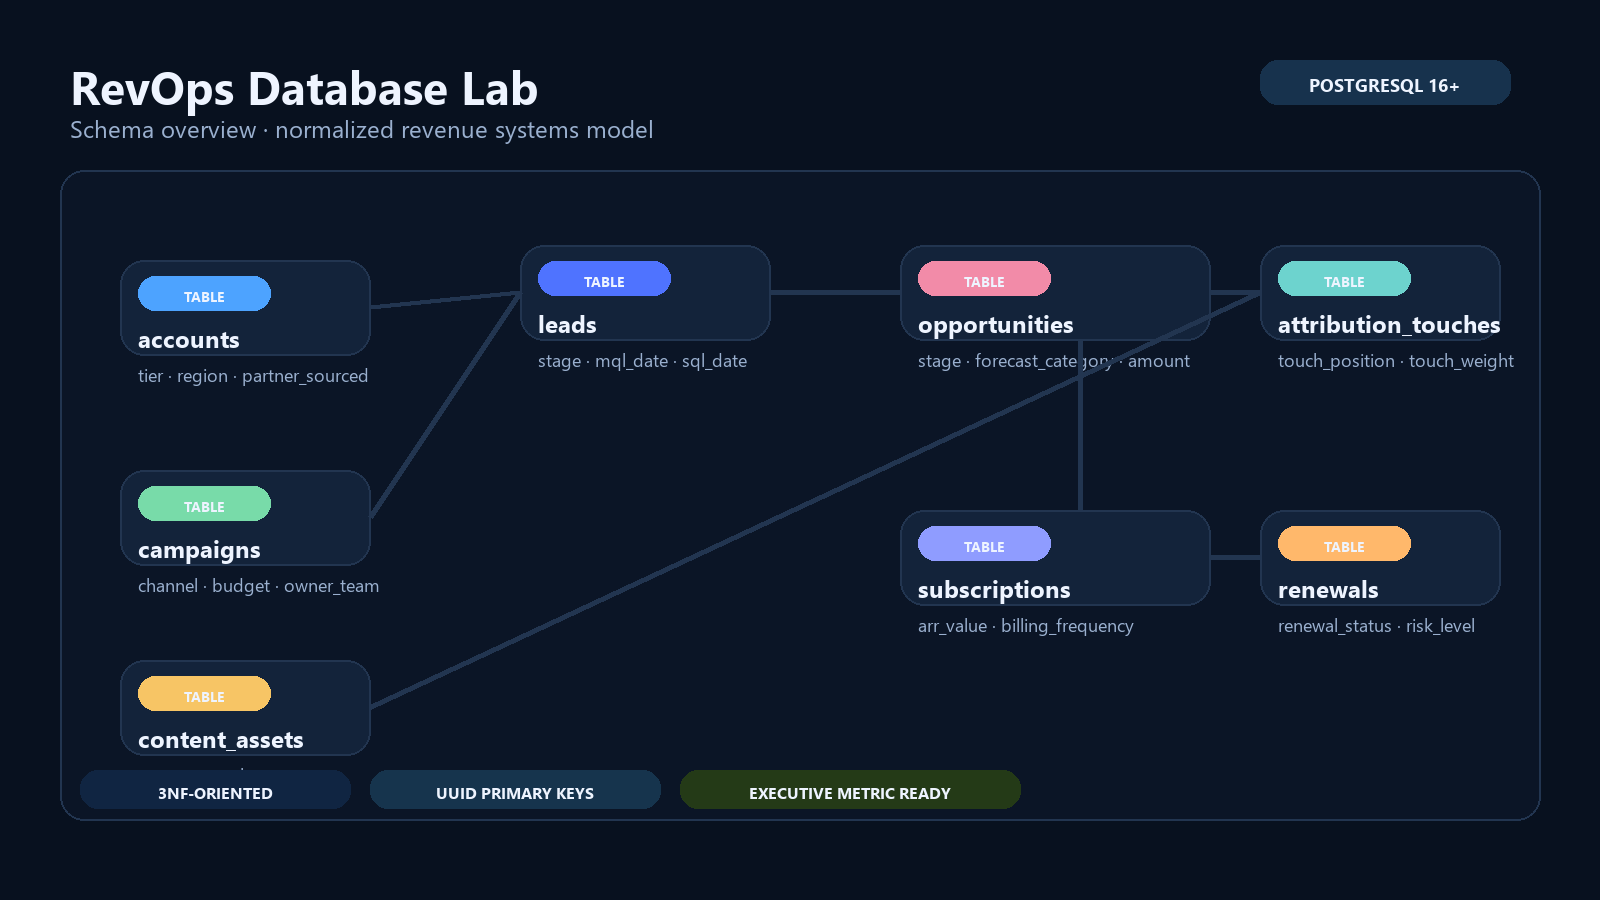
flowchart LR
  A["accounts"] --> B["leads"]
  A --> C["opportunities"]
  A --> D["subscriptions"]
  A --> E["renewals"]
  F["campaigns"] --> B
  G["content_assets"] --> H["attribution_touches"]
  F --> H
  B --> H
  C --> H
  D --> E
| Table | Purpose | Key Columns |
|---|---|---|
accounts |
B2B customer and prospect master | account_id, industry, region, employee_count, account_tier |
campaigns |
Demand-gen spend and channel context | campaign_id, channel, budget, status, launch_date |
content_assets |
Content influence and governance layer | asset_id, asset_type, theme, owner_team, published_at |
leads |
Acquisition-stage records | lead_id, source_channel, stage, mql_date, sql_date |
opportunities |
Pipeline and forecast records | opportunity_id, stage, forecast_category, amount, expected_close_date |
attribution_touches |
Multi-touch influence mapping | touch_id, touch_position, touch_weight, touch_date |
subscriptions |
Active commercial contracts | subscription_id, arr_value, term_months, billing_frequency |
renewals |
Renewal posture and risk | renewal_id, renewal_status, risk_level, renewal_arr |
| Decision | Rationale |
|---|---|
| UUID primary keys | Clean external-safe identifiers and realistic distributed-system posture |
| Enum-backed lifecycle states | Enforces valid lead, opportunity, and renewal transitions |
| Separate attribution table | Preserves campaign and content influence without denormalizing pipeline |
| Content modeled as first-class entity | Reflects how modern GTM teams connect content to pipeline |
| Renewals split from subscriptions | Keeps current contract state separate from renewal event tracking |
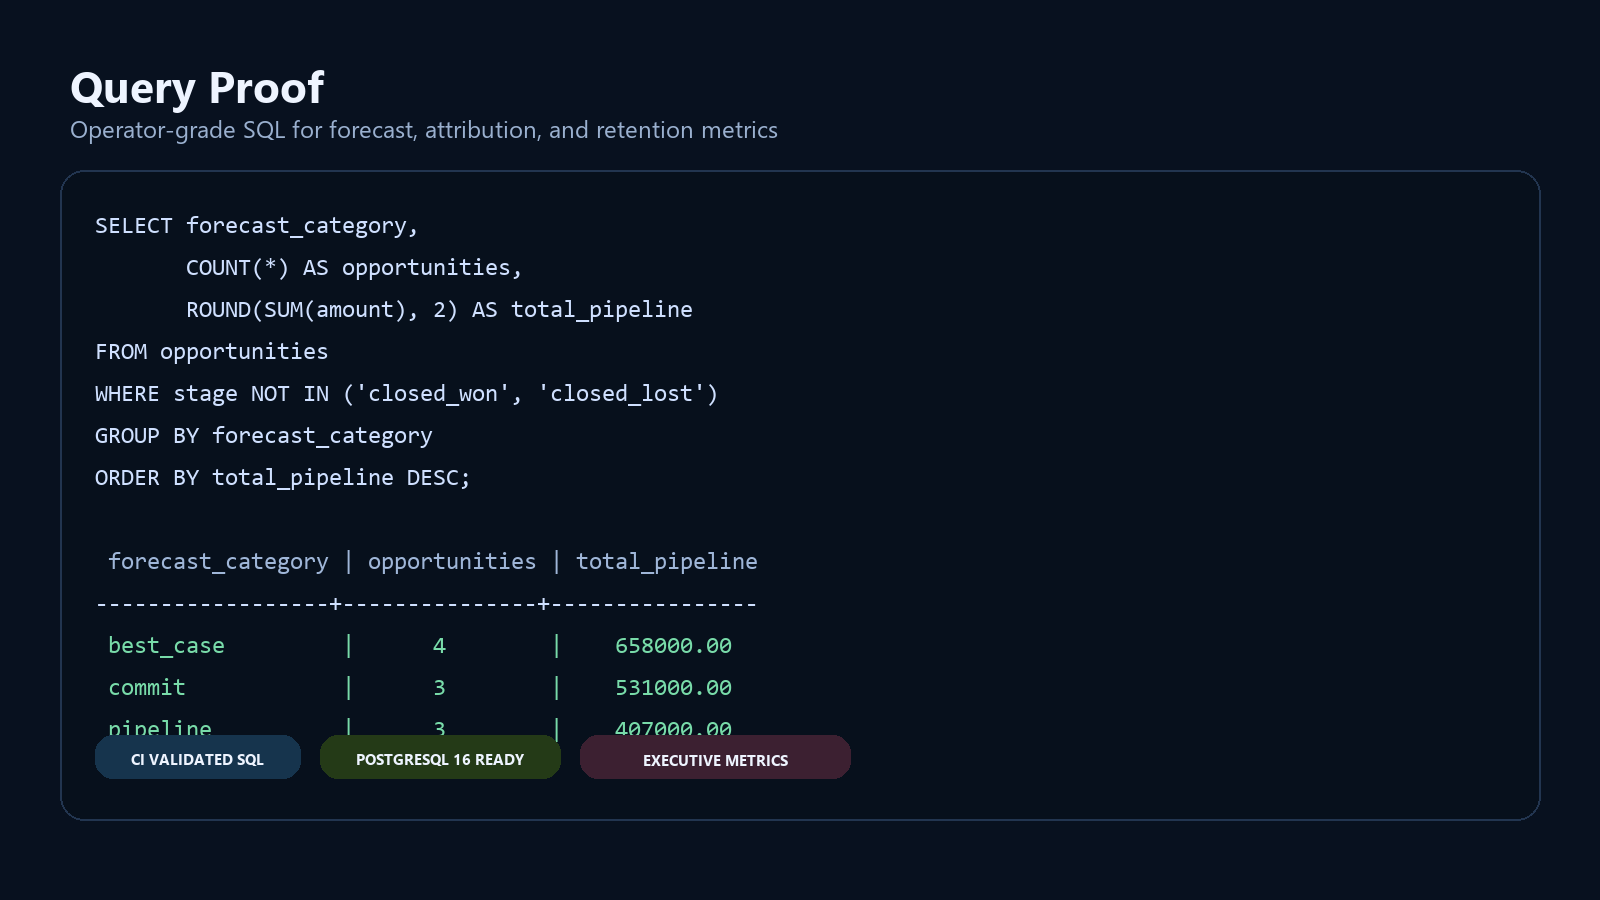
| Forecast category on opportunities | Enables commit / best-case / pipeline analysis directly in SQL |
The repo includes eight business-grade SQL analyses in sql/queries.sql:
- Pipeline Coverage by Quarter
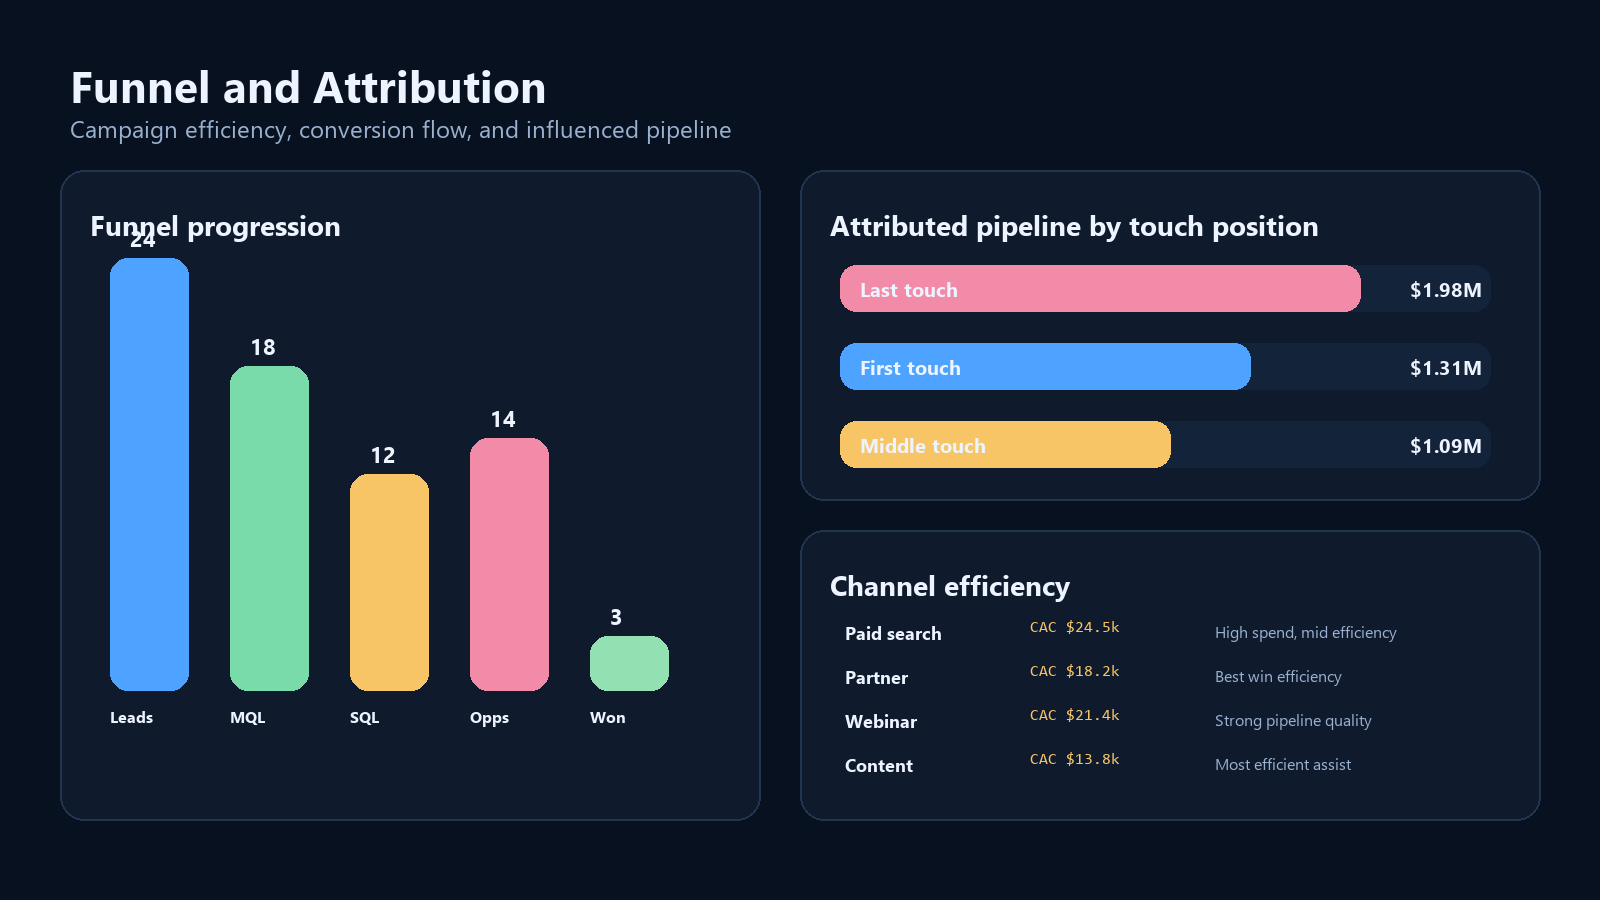
- CAC by Campaign Channel
- Lead-to-Opportunity Conversion by Campaign
- Attributed Pipeline by Touch Position
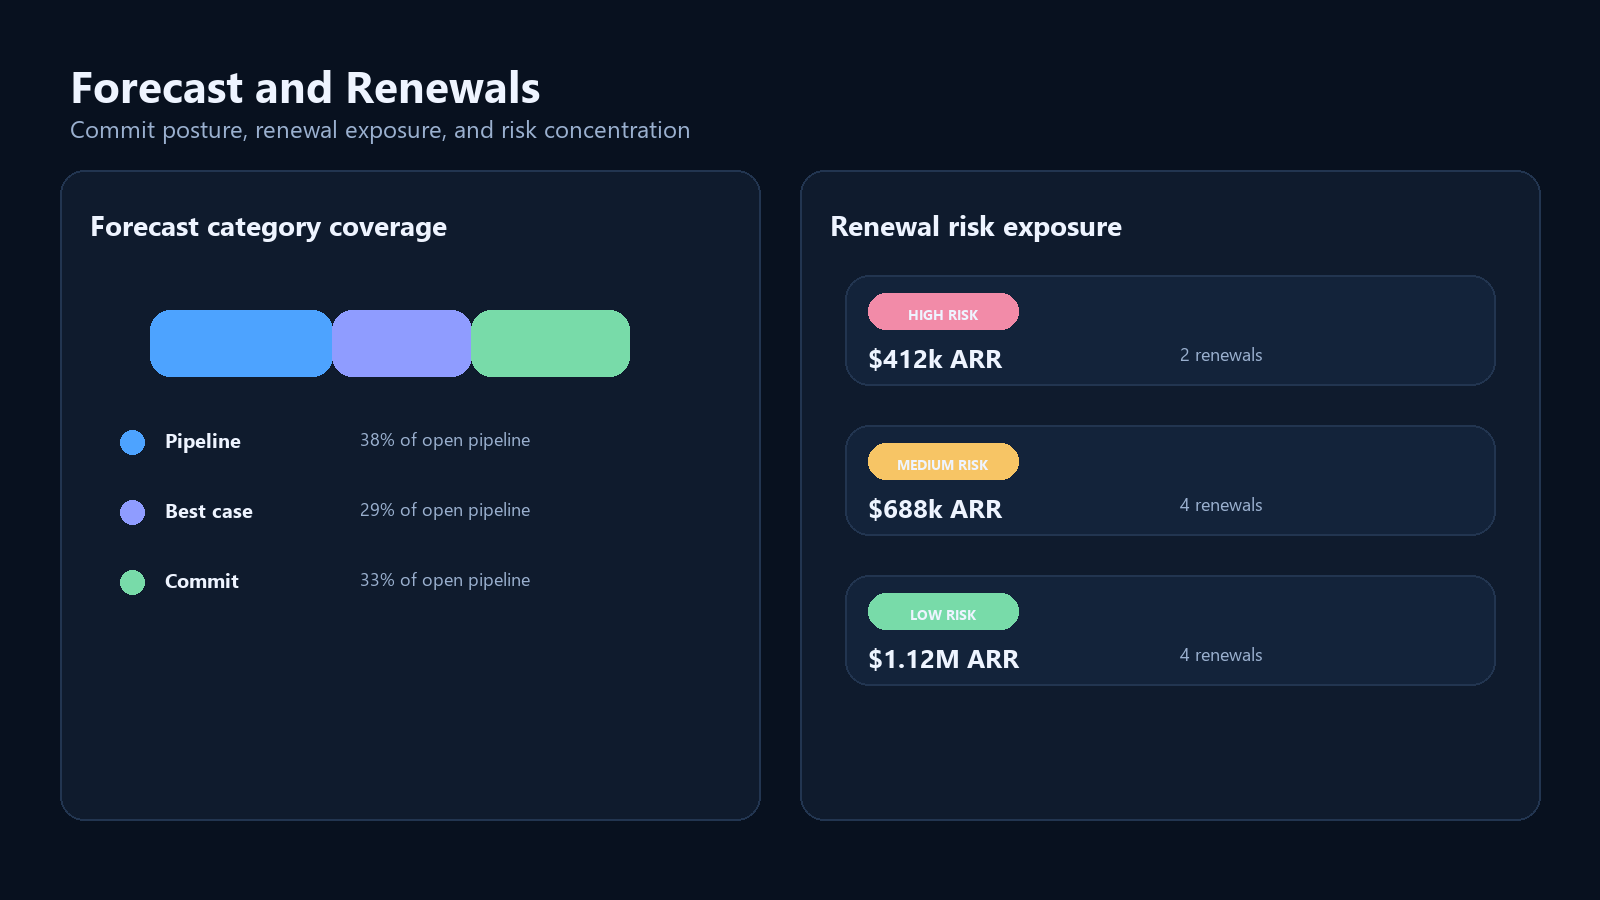
- Renewal Risk Exposure
- Forecast Category Coverage
- Content-Influenced Pipeline
- Partner-Sourced Win Performance
SELECT forecast_category,
       COUNT(*) AS opportunities,
       SUM(amount) AS total_pipeline
FROM opportunities
WHERE stage NOT IN ('closed_won', 'closed_lost')
GROUP BY forecast_category
ORDER BY total_pipeline DESC;createdb revops_lab
psql -d revops_lab -f sql/schema.sql
psql -d revops_lab -f sql/seed.sql
psql -d revops_lab -f sql/queries.sqldocker run --name revops-lab -e POSTGRES_PASSWORD=postgres -e POSTGRES_DB=revops_lab -p 5432:5432 -d postgres:16
psql -h localhost -U postgres -d revops_lab -f sql/schema.sql
psql -h localhost -U postgres -d revops_lab -f sql/seed.sql
psql -h localhost -U postgres -d revops_lab -f sql/queries.sql- GitHub Actions CI provisions PostgreSQL and runs schema, seed, and analytics SQL
- Local validation in this environment may depend on whether
psqlis installed - The SQL artifacts are structured to run cleanly in CI against PostgreSQL 16
- normalized schema design for revenue systems
- realistic B2B SaaS seed modeling
- multi-touch attribution structure
- forecast and renewal analysis
- content and campaign influence modeling
- SQL fluency tied to business decisions, not toy examples
- materialized views for executive dashboards
- dbt transformations and source freshness tests
- dimensional reporting layer for BI consumption
- synthetic monthly snapshots for trend analysis
- role-based query access examples