Draft, Project In Progress
| Term | Definition |
|---|---|
| Carbon Intensity | Carbon emitted per energy unit. |
| Grid-based carbon intensity | All entities who operate on a shared electrical grid, share a common emission rate. |
| Carbon Aware | Adjusted behavior in response to the carbon intensity of consumption. |
| Carbon delta | The difference in emissions between carbon aware and unaware actions. |
| Carbon counterfactual | The carbon delta had the carbon aware action been different. |
| Demand Shifting | Selectively changing the time/location of a compute's execution, to a time/location where the energy demands are met by cleaner energy production, resulting in a lower grid-based carbon intensity. |
Other definitions for the Carbon Awareness found at:
Green Software Foundation Dictionary

To enable organizations to make smart decisions about their environmental impact and carbon footprint, we have created the Carbon Aware API to minimize the carbon emissions of computational workflows. A few key features of the API are:
-
Utilizes marginal carbon emission from WattTime to identify carbon intensity per region
-
Generates a retrospective carbon emission analysis
-
Provides forecasted demand shifting suggestions
-
Supplies regional carbon intensity information over different scopes
Marginal Carbon Emissions: This grid-responsive metric with finer granularity than average emissions, allows for seasonality/diurnal trends captured in demand shifting (source).
Retrospective Analysis: Time series evaluation to assess the carbon emissions for a given energy profile. Also provides counterfactual analysis to expose the potential emissions of if the run had been shifted.
Demand Shifting Scheduler: Recommends region and/or time which would yield a less carbon intensive run.
-
Temporal: Identifies the window of minimum carbon intensity for a specified run duration within a chosen region from a 24-hour forecast.
-
Geographic: Finds the region with the current lowest average carbon intensity for an immediate run of a specified duration. Can filters available regions by available SKU and migration laws for workspaces with protected data.
Regional Carbon Intensity: Provides the carbon intensity for each data center supported by a WattTime- tracked balancing authority. The possible scopes are historic intensities (time series for prior 24-hours, week, and month), real-time marginal intensity, and forecast (mean intensity for upcoming user- defined window).


 utils.py
data.py
services
routes
utils.py
data.py
services
routes

Retrospective Analysis: By mapping grid-based marginal carbon intensity measurements to energy consumption profiles, the carbon footprint of cloud workloads is identified and evaluated. Part of this evaluation is to find carbon counterfactual emissions of if carbon aware scheduling was used, reporting possible outcomes of temporal and geographic shifts.
Given the following:
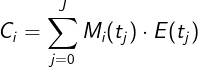
Where:
- t = discrete time vector
- M(t) = marginal operating emission rate (MOER) for a given region (i) at a certain point in time (j) for J number of timestamps.
- E(t) = energy consumed per time interval
- Ci = carbon emitted for a given region and time window (C0 is the result from the M(t) for when and where the run was executed)
- C = vector of carbon emissions resultant of different initial conditions for M(t)
Using C the carbon couterfactuals can be identified because each value is the outcome of a different potential workload shift.
Demand Shifting: Combining carbon intensity forecasts from a certified provider, with anticipated workload constraints such as runtime, governance, and needed hardware, a green window can be found in the forecasted time span.
Given the following:
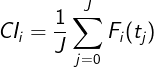
Where:
- t = discrete time vector
- F(t) = forecasted marginal operating emission rate (MOER) for a given region (i) at a certain point in time (j) for J number of timestampes.
- CIi = mean forecasted carbon intensity for a given region and time window
- CI = vector of mean forecasted carbon intensities
Followed by:
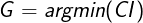
The green suggestion (G) is the time period in the forcast span at a specific data center that yields the minimum mean forecasted carbon intensity. The goal of the Carbon Aware API is to find which start time (t0) and/or location that would result in the least carbon to be emitted.
For each permitted data center all possible windows in the forecast span are searched to find the lowest average emitter.
- Time-shifting: no data center variation permitted. Sliding search to find best start time for the green window.
- Geographic-shifting: no start time variation. Evaluates permitted data centers to find the greenest location for an immediate start.
- Complete Shifting: data center and start time variation. Sliding search to find best start time for the green window across all permitted data centers.
For complete and geographic shifting, permitted data centers can be filtered based on regional data governance laws or which GPU SKU's are available.
Carbon intensity data for validation provided by: WattTime
Details: For the purpose of demand shifting, the effectiveness of using a carbon intensity baseline is compared against using a granular search. The baselines are the annual and monthly marginal emissions rate averages for respective regions, and the data granularities used are 1-hour and 5-minutes.
| Years Evalulated | Specific Months Evaluated for Each Year |
|---|---|
| 2020 | January |
| 2021 | April |
| July | |
| October |
Working Data
- Using the Historical Emissions endpoint, CI data is reported at 5-minute intervals in month batches by default for each of these regions.
- Monthly Average Baseline: Mean MOER over the calander month
- Annual Average Baseline: Mean of Monthly Average Baselines
- 1-Hour CI Reporting Granularity: Mean of aggregated MOER values from 5-minute interval .
Results Validation in-progress
Details:
Results: Validation in-progress
For more information, please see: Tool Validation
Carbon intensity data for case studies provided by: WattTime
Details: Geographic shifting compute instances at scale would reduce carbon by X% over the month
Results: Analysis in-progress
For more information, please see the full case study: Demand Shifting at Scale of Organizational Operations
Details: Execute and progress cloud computes during low emission periods to reduce the carbon footprint by Y kg
Results: Analysis in-progress
For more information, please see the full case study: Carbon Segmented Cloud Computes
Details: Shifting 1% of a data centers workload over a day would reduce overall emissions by Z.
Results: Analysis in-progress
For more information, please see the full case study: Bulk Workload Shifting for Data Centers