There are several components to our EK centralized monitoring and alerting stack.
Cloudwatch logs gather application logs and events. Cloudtrail, X-Ray, Prometheus are services to monitor application performance and capture metrics.
All logs are aggregated into Elasticsearch for ease of realtime search and access. Kibana is an elasticsearch feature enabling us to visualize and analize our application events so we can track load, troubleshoot and monitor our entire platform.
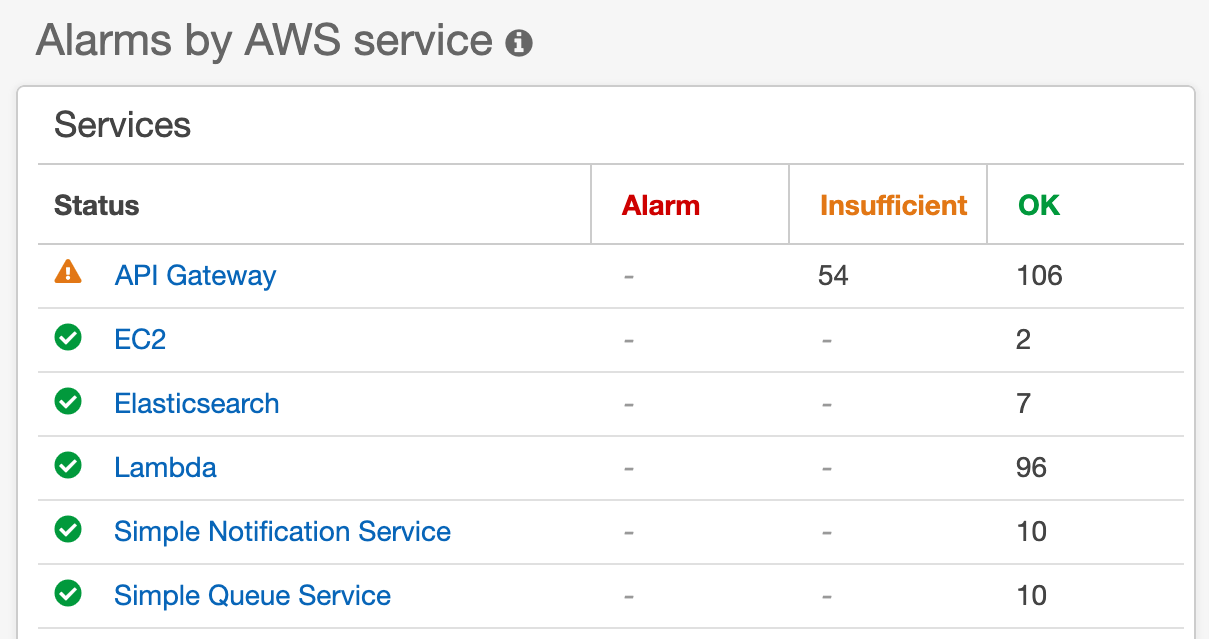
Cloudwatch alarms automate resource and latency alerts across our critical services.
Cloudwatch alarms are automatically generated and triggered by Deployment Events. Alarms are pushed to monitoring-dev@system.com and monitoring-prod@system.com as well Slack #alerts channel.
| API Gateway | EC2 | ElasticSearch | SNS /SQS |
|---|---|---|---|
| 5XX / 4XX | StatusCheckFailed | ClusterStatus.Red | NumberOfNotificationsFailed |
| Latency | Memory/CPU | ClusterIndexWritesBlocked | Deadletter |
| Lambda Error |
This project is built in node / typescript and runs on AWS serverless architecture. The three applications associated with each environment are:
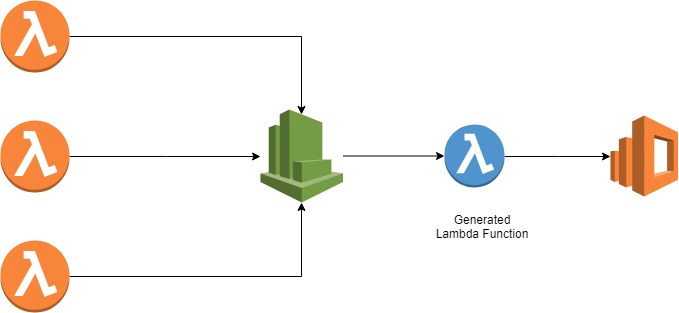
Application includes custom functions to tag new and existing log groups by environment, push log events to ES and autocreate Cloudwatch alarms by resource, triggered by Cloudtrail events.
Autosubscribes new and existing Cloudwatch Log groups to a custom Lambda function
There are several custom Lamda functions that rely heavily on AWS Javascript SDK for the following Classes and Methods: AWS.CloudWatch, AWS.CloudWatchLogs, AWS.APIGateway, AWS.Lambda, AWS.SNS, AWS.SQS
NOTE: All Lambda Alarm functions filter for resources with -dev and -prod substrings within the name. Any new applications or resources using this naming convention will be automatically included.
Creates and updates API Gateway endpoint alarms, triggered via aws.apigateway:CreateDeployment event
Creates and updates Lambda/ES/SNS/SQS alarms, triggered via aws.apigateway:CreateDeployment event
Creates and updates Autocalse/EC2 alarms, triggered via aws.autoscaling:UpdateAutoScalingGroup event
Sends subscribed cloudwatch log data to ElasticSearch
Classifies and tags existing log groups env=dev or env=prod
Classifies and tags new log groups env=dev or env=prod
Adding a new alarm is fairly straightforward once we have defined:
- What AWS events will trigger the creation of this alarm? Consider existing resources as well as new resources.
- What Resource group and metric will this alarm monitor?
Available Resource Metrics: AWS/ApiGateway, AWS/Lambda, AWS/EC2, AWS/ES, AWS/SNS
  AlarmName: `EC2 for Autoscale group[${autoscaleGroup}] :  Status Check Failed for over 1 min`,
  MetricName: "StatusCheckFailed",
  Dimensions: [
    { Name: 'AutoScalingGroupName', Value: autoscaleGroup }
  ],
  Namespace: 'AWS/ES',
  ComparisonOperator: 'GreaterThanOrEqualToThreshold',
  Period: 300,
  Threshold: 1,
  EvaluationPeriods: 2,
  DatapointsToAlarm: 2, // 1  mins to trigger alarm
  Statistic: 'Maximum',
  ActionsEnabled: true,
  AlarmActions: alarmActions,
  AlarmDescription: `auto-generated by Lambda [${process.env.AWS_LAMBDA_FUNCTION_NAME}]`,
  OKActions: okAction,
  TreatMissingData: "notBreaching",
  Unit: 'Milliseconds'
  // Run these asynchronously
  const lambdaPromise = lambdaAlarms.createAlarms()
  const esPromise = esAlarms.createAlarms()
  const snsPromise = snsAlarms.createAlarms()
  const queuePromise = queueAlarms.createAlarms()

  await lambdaPromise
  await esPromise
  await snsPromise
  await queuePromise