Repository navigation
R package
The R package monitoreo calls, with reticulate, the functions of the Python
package: it computes exactly the same as the QGIS plugin and the MCP server. It returns data.frames, GeoTIFF paths
for terra and, with rgee, Earth Engine images.
The options (regions, periods, metrics, filters) are explained in Concepts. The examples on this page are real and use the Sierra Nevada National Park (WDPA ID 389011).
-
The Python of MonitorEO. The simplest is the conda environment of Getting started (and
earthengine authenticate, only to use your Earth Engine account). -
The R package, from GitHub:
install.packages(c("remotes", "reticulate", "ggplot2", "sf", "terra", "leaflet"))
remotes::install_github("monitoreo-obsnev/monitoreo", subdir = "r/monitoreo")
For a specific version (the one cited with its DOI), add
ref = "v0.3.2"; from a clone of the repository,install.packages("r/monitoreo", repos = NULL, type = "source"). -
Tell R which Python to use, before loading the package or in
~/.Renviron:Sys.setenv(RETICULATE_PYTHON = "/Users/ana/miniforge3/envs/monitoreo/bin/python") # Windows: "C:/Users/ana/miniforge3/envs/monitoreo/python.exe"
If you already use rgee with its own Python, you can install the Python package in it with
mo_install().
library(monitoreo)
mo_init()                        # without the EE_PROJECT variable: the shared account of MonitorEO
# mo_init("my-ee-project")       # or your account and your project (or mo_init() with EE_PROJECT); mo_init(""): the shared one
mo_eecu()                       # your EECUs of this month; with your project, mo_eecu("Contributor") if that is its tier
With the shared account they are your research EECUs (25 EECU-h per month, for research only): if less than 10 %
is left, mo_init() and the functions that compute give a warning() (once a month) asking you to switch to your
account, and when they run out the shared account does not compute until the next month
(Concepts).
When loaded, the package shows the description and the acknowledgements of MonitorEO; mo_about("en") gives them in
English.
mo_variables(sensor = "Modis", text = "NDVI")[, c("ref", "variable", "sensor", "collection", "resolution_m")] ref variable sensor collection resolution_m
1 25 NDVI Modis MODIS/061/MOD13Q1 250
2 26 NDVI Modis MODIS/061/MYD13Q1 250
mo_protected_areas("Doñana")[, c("SITE_ID", "NAME", "DESIG", "IUCN_CAT")] SITE_ID NAME DESIG IUCN_CAT
1 555588792 Doñana Zona de Importancia Comunitaria ZIC (ZEPA/ZEC) IV
2 555595662 Doñana Norte y Oeste Zona de Importancia Comunitaria ZIC (ZEPA/ZEC) IV
3 389012 Doñana Parque Nacional II
4 349268 Doñana Parque Natural V
...
Regions are built with functions:
sn <- mo_wdpa(389011)                          # one or several protected areas: mo_wdpa(c(389011, 389012))
mo_ecoregion(793)                              # ecoregion by ID, or mo_ecoregion(lon = -3.3, lat = 37.1)
mo_bbox(-3.6, 36.9, -2.6, 37.3)                # west, south, east, north
mo_point(-3.42, 37.13, buffer = 1500)          # circle of 1.5 km
zones <- mo_sf(sf::st_read("zonas.gpkg"), "nombre") # any sf object of polygons; one series per polygonts <- mo_time_series(sn, "NDVI", "Sentinel-2", "2022-01-01", "2023-12-31", step = "monthly")
head(ts, 3) date n_images n_pixels region value
1 2022-01-01 30 346520 Sierra Nevada 0.3536522
2 2022-02-01 29 298880 Sierra Nevada 0.4035685
3 2022-03-01 31 224912 Sierra Nevada 0.2237470
It is a data.frame with Date dates and the attributes title, unit and scale (the pixel used, here 50 m).
mo_plot(ts)                                    # ggplot2: you can keep adding layers
write.csv(ts, "ndvi.csv", row.names = FALSE)   # or mo_time_series(..., csv = "ndvi.csv")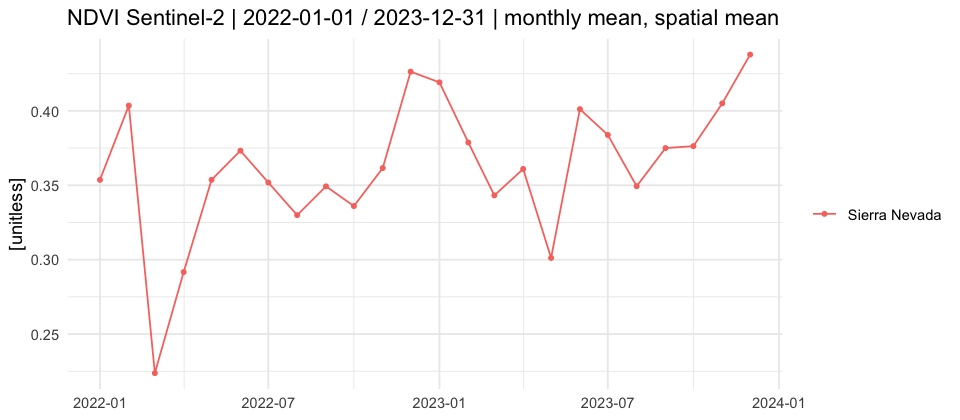
More examples:
mo_time_series(sn, "LST", "Landsat", "2015-01-01", "2023-12-31", step = "annual", metric = "max")
mo_time_series(zones, "NDVI", "Sentinel-2", "2023-01-01", "2023-12-31", season = c("06-01", "09-30"))
mo_time_series(sn, "NDSI", "Modis", "2022-10-01", "2023-06-30", step = "16-day", quality = list(snow = FALSE))Earth Engine tiles in leaflet (over an orthoimage):
layer <- mo_map_layer(sn, "NDVI", "Sentinel-2", "2023-06-01", "2023-08-31")
mo_leaflet(layer)
With rgee, the Earth Engine image and its colour ramp:
x <- mo_image(sn, "LST", "Modis", "2023-06-01", "2023-08-31", metric = "mean")
rgee::Map$centerObject(x$image, 10)
rgee::Map$addLayer(x$image, x$vis, x$name)
Statistics of a map in each polygon:
mo_region_stats(sn, "LST", "Modis", "2023-06-01", "2023-08-31", metric = "mean")
#          region     mean      std      min       p5      p50      p95      max n_pixels
# 1 Sierra Nevada 32.20741 1.976974 27.26778 29.40603 32.08767 34.90077 40.85588     1051
As GeoTIFF, for terra (small or medium regions; for large ones, use mo_export_image() to Google Drive):
f <- mo_download_image(mo_point(-3.42, 37.13, 1500), "NDVI", "Sentinel-2", "2023-01-01", "2023-12-31",
                       path = "ndvi_p95.tif", metric = "p95")
terra::plot(terra::rast(f$file))The trend of the NDVI of each month from 2005 to 2024 (MODIS):
tr <- mo_trend_table(sn, "NDVI", "Modis", "2005-01-01", "2024-12-31", step = "monthly")
tr[, c("label", "n", "tau", "p_value", "significant", "slope")]
label n tau p_value significant slope
1 January 20 -0.06315789 0.697031003 FALSE -0.0002659812
2 February 20 0.07368421 0.649670504 FALSE 0.0006624354
3 March 20 0.25263158 0.119393190 FALSE 0.0014753512
4 April 20 0.04210526 0.795207612 FALSE 0.0003653394
5 May 20 0.10526316 0.516412268 FALSE 0.0008568967
6 June 20 0.18947368 0.242809091 FALSE 0.0011871008
7 July 20 0.17894737 0.269981282 FALSE 0.0013375445
8 August 20 0.45263158 0.005267412 TRUE 0.0018529123
9 September 20 0.36842105 0.023140931 TRUE 0.0019901468
10 October 20 0.13684211 0.398920137 FALSE 0.0010093510
11 November 20 0.12631579 0.436178362 FALSE 0.0011457025
12 December 20 0.10526316 0.516412268 FALSE 0.0004527001
Only August and September have a significant trend (p < 0.05): about +0.002 NDVI units per year. attr(tr, "yearly")
has the values of each year and mo_trend_table(..., chart = "trends.png") draws the chart of each month with its Sen
line.
In each pixel, as GeoTIFF with the bands slope, tau, z, p_value, intercept and n:
f <- mo_download_trend(sn, "NDVI", "Modis", "2005-01-01", "2024-12-31", path = "trend.tif")   # step = "annual"
r <- terra::rast(f$file)
r
class : SpatRaster
size : 121, 315, 6 (nrow, ncol, nlyr)
resolution : 250, 250 (x, y)
coord. ref. : WGS 84 / UTM zone 30N (EPSG:32630)
names : slope, tau, z, p_value, intercept, n
slope <- terra::ifel(r$p_value < 0.05, r$slope, NA)      # only the significant trend
terra::plot(slope, col = hcl.colors(11, "RdYlGn"), range = c(-0.005, 0.005))
For one month: step = "monthly", part = 8 (August). The tile map: mo_leaflet(mo_trend_map(...)).
cmp <- mo_compare_series(sn, "NDVI", "Modis", "2005-01-01", "2009-12-31",    # reference
                         "2020-01-01", "2024-12-31")                         # other period
head(cmp[, c("label", "reference", "other", "difference")], 3)
label reference other difference
1 January 0.4954321 0.4952818 -0.0001502843
2 February 0.4680880 0.4829461 0.0148581591
3 March 0.4335899 0.4606720 0.0270820311
The map of the difference: mo_compare_map() (tiles) or mo_download_comparison() (GeoTIFF with the bands
difference, reference and other).
s <- mo_burn_severity(mo_wdpa(389013), "2023-05-15", "2023-08-14", "2023-09-15", "2023-11-30",
                      path = "severity.tif")          # Sentinel-2; sensor = "Landsat" for earlier fires
s[s$class >= 1, c("label", "ha")]                     # hectares of each severity class
terra::plot(terra::rast(attr(s, "file"))$severity)
r <- mo_burn_severity(mo_wdpa(389013), "2023-05-15", "2023-08-14", "2023-09-15", "2023-11-30",
index = "RBR", path = "rbr.tif") # the RBR: mean, median, p10, p90, min, max and hatask <- mo_export_image(sn, "NDVI", "Sentinel-2", "2023-01-01", "2023-12-31", resolution = 10, folder = "MonitorEO")
mo_task_status(task$operation)
mo_download_variables("recipe.yaml", "zone.gpkg", "variables", dry_run = TRUE) # recipe: see the Python package page
mo_download_variables("recipe.yaml", "zone.gpkg", "variables")
terra::rast(list.files("variables", "\\.tif$", full.names = TRUE))The recipe can be a YAML or an R list (yaml::read_yaml()); its format is in
Python package.
| Function | What it does |
|---|---|
mo_init(), mo_install(), mo_about()
|
Connect, install the Python package, description and acknowledgements |
mo_eecu() |
Your Earth Engine EECUs spent this month (research EECUs with the shared account) |
mo_variables(), mo_describe()
|
Variables of the catalog |
mo_protected_areas() |
Search WDPA protected areas |
mo_wdpa(), mo_ecoregion(), mo_bbox(), mo_point(), mo_geojson(), mo_sf()
|
Regions |
mo_time_series(), mo_plot()
|
Time series and its chart |
mo_map_layer(), mo_leaflet(), mo_image()
|
Maps: tiles, leaflet and rgee |
mo_region_stats() |
Statistics of a map by polygon |
mo_download_image(), mo_download_variables()
|
GeoTIFF on the computer |
mo_trend_table(), mo_trend_map(), mo_download_trend()
|
Seasonal trends |
mo_compare_series(), mo_compare_map(), mo_download_comparison()
|
Comparison of periods |
mo_burn_severity() |
Burn severity (dNBR, USGS classes; or the RBR with index = "RBR") |
mo_export_image(), mo_export_time_series(), mo_task_status()
|
Exports to Google Drive |
The arguments are those of the functions of the same name of the Python package.
MonitorEO es un resultado del Proyecto EVEREST (PID2023-151939OB-I00), financiado por MICIU/AEI 10.13039/501100011033 y cofinanciado por FEDER – Unión Europea, y del Proyecto NevadEO (C-EXP-074-UGR23), cofinanciado por el Programa FEDER 2014-2020 y la Consejería de Economía, Conocimiento, Empresa y Universidades de la Junta de Andalucía. Es también un resultado del Proyecto PRESINMED (Preserving the singularity of Mediterranean high-mountain biodiversity hotspots: a NBS approach, PCI 2025-163175) de la convocatoria Biodiversa+ NBS 2023.
MonitorEO is an output of the EVEREST Project (PID2023-151939OB-I00), funded by MICIU/AEI 10.13039/501100011033, and co-funded by ERDF – European Union, as well as of the NevadEO Project (C-EXP-074-UGR23), co-funded by the ERDF 2014-2020 Program and the Regional Ministry of Economy, Knowledge, Enterprise, and Universities of the Regional Government of Andalusia. It is also an output of the PRESINMED Project (Preserving the singularity of Mediterranean high-mountain biodiversity hotspots: a NBS approach, PCI 2025-163175) of the Biodiversa+ NBS 2023 call.
OBSNEV, Universidad de Granada · GPL-3.0-or-later


