Better performance profiling #2133
Conversation
 Pirulax
left a comment
Pirulax
left a comment
There was a problem hiding this comment.
Nice.
I'd drop using hungarian notation tho, it's useless, makes your code uglier.
| void SetArg(const char* szKey, int value); | ||
|
|
||
| protected: | ||
| std::string m_szName; |
|
|
||
| protected: | ||
| std::string m_szName; | ||
| const char* m_szCategory = "default"; |
| std::string m_szName; | ||
| const char* m_szCategory = "default"; | ||
| private: | ||
| TIMEUS m_start = 0; |
There was a problem hiding this comment.
m_startTime or something more descriptive
|
Also, not directly related to this PR, but I think there should be a special debug build of MTA, where all this debug stuff is enabled, because in the long run the profiler itself might cause performance issues. |
|
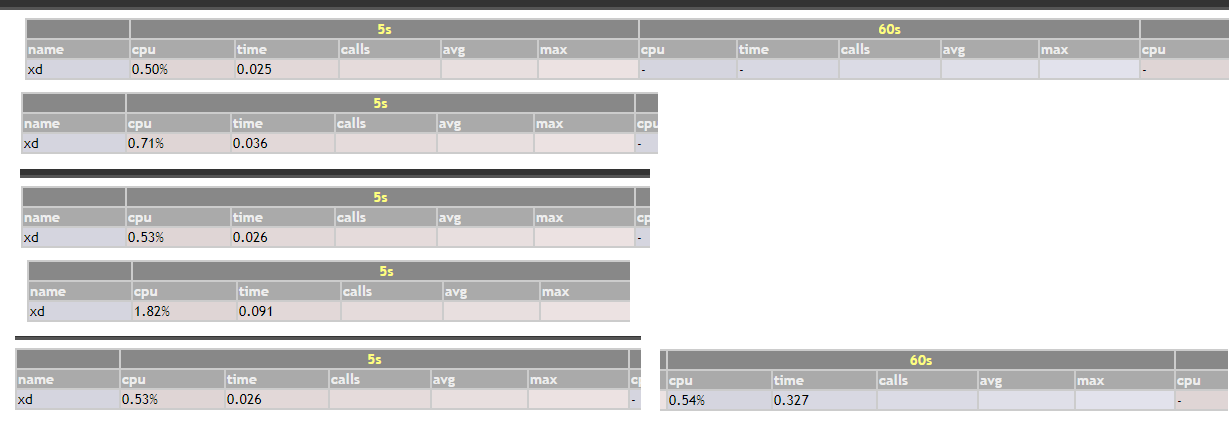
performancebrowser already shows you which functions in a resource use high CPU and what MTA functions (server side only) are using what. I don't understand why anyone would need any more. It would have been time better spent improving performance like the bug that causes GTA SA sounds to use a huge amount of FPS: #1067 |
|
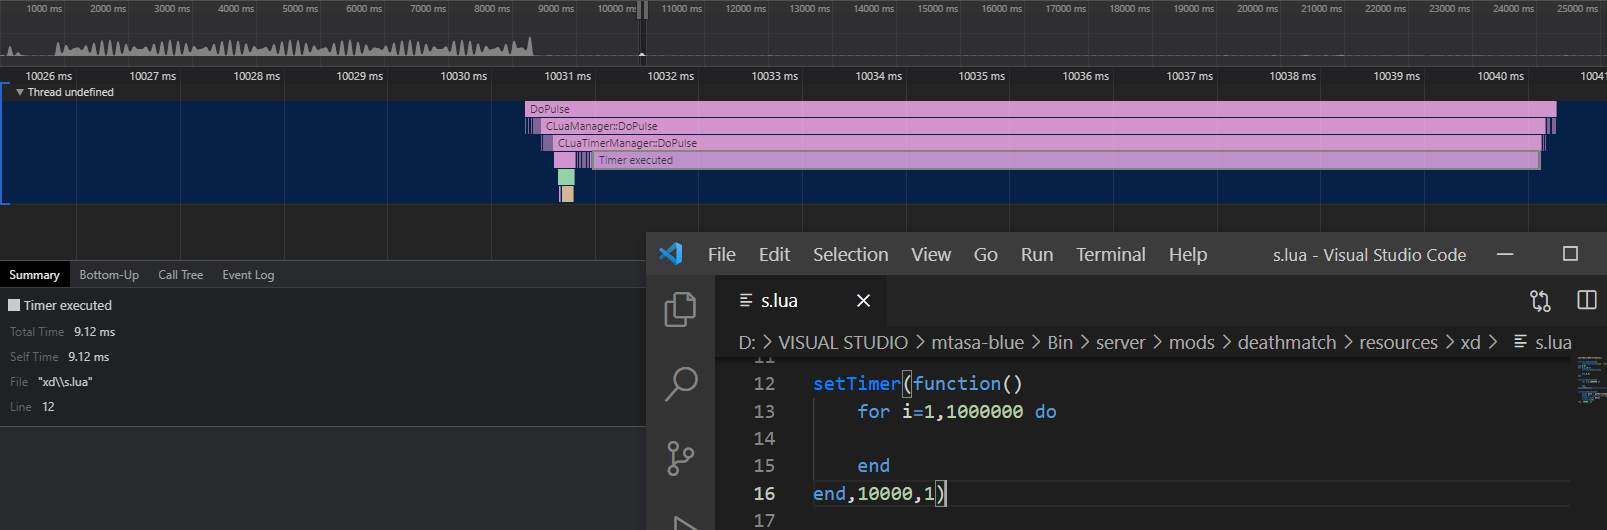
Take for example this chunk of code: common case when some timer internal logic cause sudden cpu spike, while my approach told me exactly where is the source of cpu spike: |
|
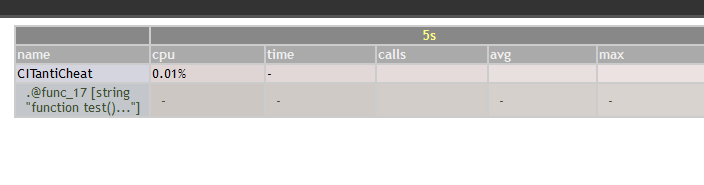
That's because there is no function name. I just tested it with a function name via runcode and it gave me:
|
|
I think that, although a Chromium-based web browser is indeed pretty universal, depending on one to show this profile data is kind of awkward. I think that a browser-agnostic solution would be better, as after all web standards exist so Chrome doesn't become the new Internet Explorer. For example, I use Firefox as my daily web browser, and having to switch to another web browser just for this is, at least, inconvenient. I suggest generating this profile information in a format that is compatible with profiler.firefox.com, a web application that works on all major web browsers that allows inspecting JSON profile data. I've just uploaded your example profile there, which you can see on this link, and it kinda works, so I'd say the generated profiles are in the right path at least. Addressing @ArranTuna comments, performancebrowser is more focused on measuring the CPU usage of the Lua VM, memory usage and network usage, while this PR, as I understand it, instruments time-critical regions of MTA: SA source code to generate profile data, like |
|
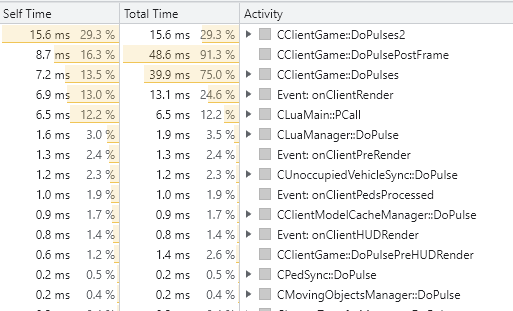
I've tested this PR and it's, interesting. CLuaMain::PCall - is this lua scripts executing? I did this: crun clearPerformanceRecorder() startRecordPerformance() setTimer(function() stopRecordPerformance() setClipboard(getRecordedSamples()) end, 5000, 1) On play at a spawn:
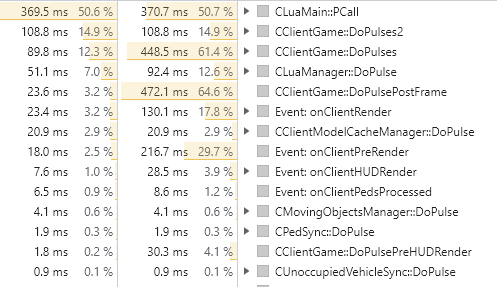
With CIT scripts running in a busy area:
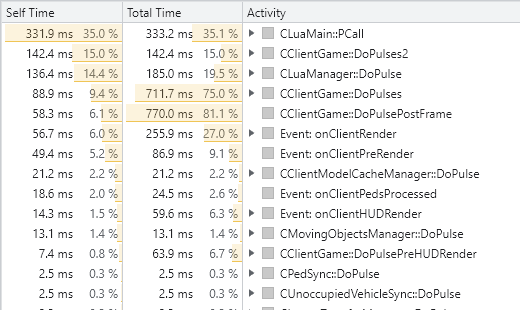
Even though I had FPS set to unlimited there are huge gaps in the chart, is this all the stuff that doesn't have a sample added or is it GTA SA code so can't have any sampling on the gaps? I then did CIT scripts in a quiet area (I had 300 FPS instead of 100):
The miliseconds breakdown doesn't seem much different even though FPS was so much different so is that because GTA SA stuff which can't be sampled being what's causing the difference? |
|
Merge conflicts must be resolved. Also like @Pirulax mentioned performance profiling should be enabled/compiled only for debug builds. |
with current knowlage, rather than enable it in debug mode only we might have a wrappers around some logics that measure performance public class LuaFunctions : ILuaFunctions
{
public setElementData(...) { ... }
}
public class LuaFunctionsWithProfiling : ILuaFunctions
{
private ILuaFunctions luaFunctions;
public LuaFunctionsWithProfiling(ILuaFunctions luaFunctions)
{
}
public setElementData(...) {
begin("function setElementData"));
luaFunctions->setElementData(...);
end("function setElementData"));
}
}
public someLuaDefs{
public static ILuaFunctions luaFunctions = nullptr;
public static setElementData(string key, ...)
{
luaFunctions ->setElementData(key,...)
}
}
CCore::SetProfilingEnabled()
{
someLuaDefs::luaFunctions = new LuaFunctionsWithProfiling (new LuaFunctions ())
} |
This idea was in my head for a long time, people uses "rescpu", popular resource to measure performance, but plain numer "10%" next to resource name does not tell the core of the cpu usage. Flag
-gdoes not help too much in figuring out what cause server/client to degradate performance. Performance stats can tell you that some part of mta cause high cpu usage, but don't why, what is the excact source of the problem.Almost everyone have a chrome or other chromium based browser which i used as a tool to display these information.
Idea is simple: make function that let you generate profile data to see them in chrome devtools:
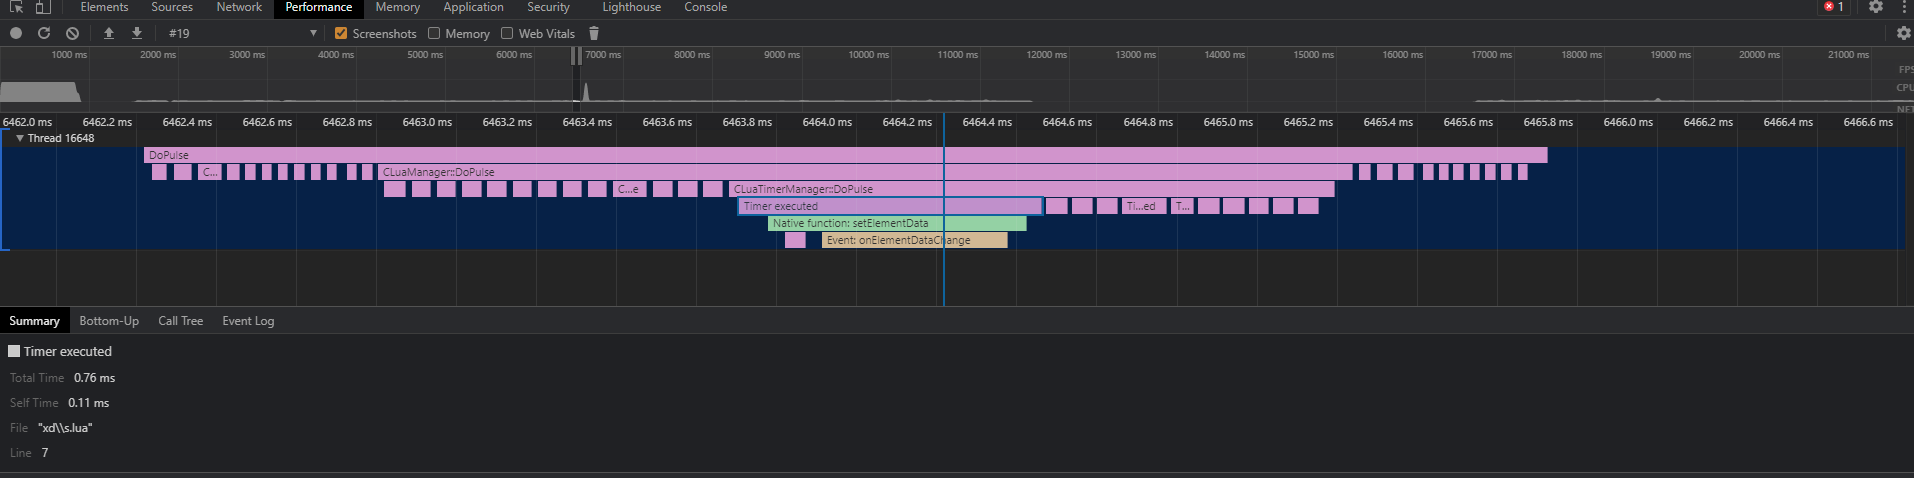
( Based on image below ) With this amount of information, i can tell that "setElementData" in timer ( location can be seen in "summary" when i click on parent box ) cause the most cpu usage due "onElementDataChange" event, not by broadcasting.
It is very easy to use by mta developers, all you have to do is to put
CPerformanceRecorder::Sample sample("name");, and everything is handled by you in background, you just set the name. There are also "FunctionSample" - to take a sample of mta native function, and "EventSample" for events. Optionaly you can useSetArgoversampleto add custom content with important informations in "summary" tab.In initial pr i want to add original timings, timers, events and setElementData function.
Example data you can test yourself by drag and dropping .json file onto "performance" tab in chrome devtools
result.zip
test code i used
Functions:
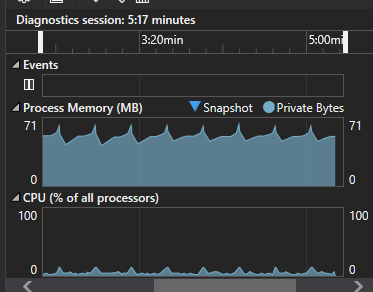
bool startRecordPerformance()- start performance recordingbool stopRecordPerformance()- stopping, pausing performance recordingbool clearPerformanceRecorder()- clearing samples bufferbool isPerformanceRecording()- returns true when performance is recordingstring getRecordedSamples()- returns string json kind with recorded samplesTest code ( 2 hours of running code below, ~300 executions did not cause any crash, memory leak. ):
Memory usage:
Example generated data: