Repository navigation
Reading the Weights
DiagramPlot writes a number in front of every picture: its weight. The rule is the one of the textbooks: the
weight, times the values of the elements of the picture, integrated over the internal points, is the term.
- a propagator stands for itself (an arrow from y to x is G(x, y));
- an interaction line (declared with
DeclareInteractionLine) stands for −V; - a vertex stands for minus its coupling (declared with
DeclareCoupling), and a local vertex (DeclareLocalVertex) for minus its kernel.
The minus signs are those of exp(−S_int): with them the weight of a diagram is its symmetry factor times the sign of its fermion loops, and does not depend on the order.
The electron gas of the README, and its self-energy at first order as the derivative of the Luttinger–Ward functional, Σ(x, y) = δΦ/δG(y, x):
Needs["FunctionalDiagrams`"]
DeclareGrassmannSource[eta, etabar];
DeclareField[psi, etabar]; DeclareField[psibar, eta, -1];
Z0 = Exp[-IntegralOver[G0[x, y] etabar[x] ** eta[y], {x, y}]];
DeclareSymmetric[V]; DeclareInteractionLine[V]; DeclareDirectedPropagator[G0, G];
interaction =
  1/2 IntegralOver[V[x, y] psibar[x] ** psibar[y] ** psi[y] ** psi[x], {x, y}];
Phi = LuttingerWardFunctional[Z0, interaction, 1, G0 -> G];
sigma = FunctionalDerivative[Phi, G[y, x]]
DeltaFunction[x, y] IntegralOver[G[z1, z1] V[x, z1], {z1}] - G[x, y] V[x, y]
DiagramPlot[sigma, {x, y}]
The Fock term, −G(x, y) V(x, y), is drawn with the weight +1: one line G and one wavy line, −V. The Hartree term, +δ(x, y) ∫ G(z, z) V(x, z), has the weight −1: (−1) × (−V) × G gives it back. The −1 is the sign of its closed fermion loop: a diagram of G or Σ with n closed loops has the weight (−1)ⁿ.
ClosedLoopCount[#, {G}] & /@ DiagramTerms[sigma]{1, 0}
The expression itself keeps the coefficients, +1 for Hartree and −1 for Fock: DiagramTerms lists the terms with
them, and DiagramPlot[sigma, {x, y}, "Weights" -> "Coefficients"] writes the coefficients in front of the pictures,
every line and vertex then standing for its own kernel.
A coupling declared with DeclareCoupling is absorbed into the vertices. The propagator of φ⁴ theory at first order:
DeclareSource[J]; DeclareField[phi, J]; DeclareSymmetric[D0]; DeclareCoupling[lambda];
Zb = Exp[1/2 IntegralOver[J[x] D0[x, y] J[y], {x, y}]];
phi4 = lambda/24 IntegralOver[phi[z]^4, {z}];
propagator = PerturbativeCorrelationFunction[Zb, {phi[a], phi[b]}, phi4, 1]
lambda IntegralOver[D0[a, z1] D0[b, z1] D0[z1, z1], {z1}]
D0[a, b] - ---------------------------------------------------------
2
The tadpole is −λ/2 ∫ D₀ D₀ D₀, and its vertex stands for −λ: its weight is ½, the symmetry factor:
DiagramPlot[propagator, {a, b}]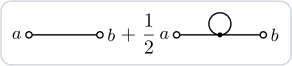
Without DeclareCoupling[lambda] the weight would be −λ/2. For one picture only, the option "Couplings" -> {lambda}
does the same as the declaration.
- An interaction declared in another style (
DeclareInteractionLine[W, "DoubleWavy"]) still stands for minus itself; a line declared only withDeclareLineStyle(a phonon,"Dashed") is a propagator and stands for itself. The option"Interactions" -> {W}treatsWas an interaction line in one picture. - An anomalous line (
"DivergingArrows","ConvergingArrows") shows no orientation: the weight reads it along its fermion line, around a loop in either sense, along an open line from its end at the first external label. - The manual, section The weights, has the details; Conventions the signs of the propagators.