PyMIDA is a graphical user interface python package that allows users to perform mass isotopomer distribution analysis (MIDA).
This program can calculate the fraction of newly synthesized molecules, the turnover rate of polymers, the isotopic enrichment of the precursor pool, and the number of atoms that are replaced or exchanged during metabolic processes.
NOTE: this software was developed on Windows 10 and also tested on Intel-based Mac OS using Python 3.9.6. The newest version of Python 3 (3.11.x) has new rules for the self keyword and may lead to compilation error. Please report any bugs or malfunctions to (mailto:naveedziari@berkeley.edu).
This package requires Python 3.x and has the following codependencies:
- numpy
- scipy
- pandas
- PyQT5
To run the program, download the pymida folder, go to its directory in the command line and run python pymida (or whatever command is used to invoke Python 3.x). This window will pop up:

- Formula: input the number of atoms found in the molecule under analysis. Any field left blank will register a zero.
- Labeled isotope: select the stable isotope that is experimentally enriched (deuterium, carbon-13, nitrogen-15)
- Enrichment: define the isotopic enrichment of the precursor pool
- p: the isotopic enrichment of the precursor pool, with acceptable range (0,1)
- number of labile bonds: the number of atoms of the labeled isotope that are exchange during the metabolic process (n)
- Display:
- increment: The increment at which each row on the MIDA table is displayed. For instance, if p is defined as 0.05 and increment as 0.01, then it will display distributions for p= 0, 0.01, 0.02, 0.03, 0.04, 0.05. Must be a factor of p (e.g. p = 0.05 and increment = 0.02 will throw an error because 0.05 % 0.02 != 0).
- number of isotopomers: Specify the number of isotopomers to normalize (correct such that the sum of the distribution is equal to one), and to display on the MIDA table (e.g. if user specifies 4, then it will display isotopomers M0, M1, M2, and M3). Must a positive integer value.
For generation of the MIDA table, user can choose to copy to a clipboard to paste into any spreadsheet program or to write it to a .csv file.
In addition, if the user wants to analyze a peptide, then under the windows tab select Proteomics to be prompted with a window to enter the peptide amino acid sequence:
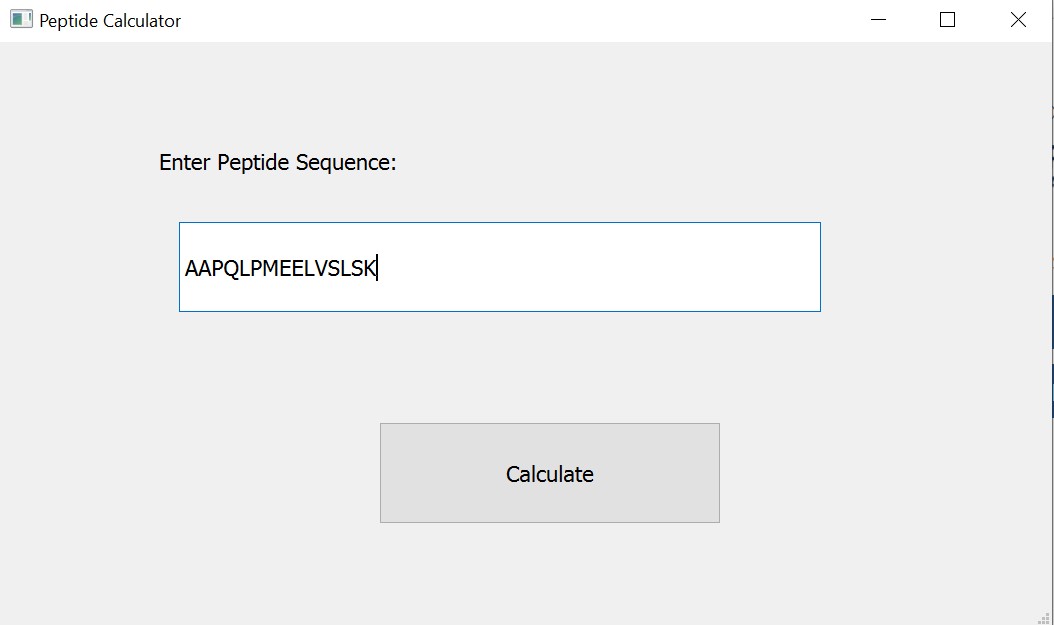
- The user may also input experimentally derived fractional abundances into the fields labeled M0-M4. At minimum M0-M2 must be populated, and the number of isotopomers specified above must match the number inputted here.
- Then click on Calculate MIDA p and a window will pop up displaying the isotopic enrichment of the precursor pool. This step is necessary in order to calculate
$f$ . - After calculating
$p$ , clicking on Calculate f will open up a new window whereby the user can select the mass isotopomer with which to calculate$f$ . Proceed with steps below to calculate FSR - Input the timepoint at which the measurement was taken, with time point zero being the start of labeling.
- Click on Calculate FSR to display the fractional synthesis rate.

Users can incorporate the implementation of the MIDA algorithm included in this software into other scripting routines to batch process data. In the same directory as the folder MIDA_algorithm, the command from mida_alg import Abundance will allow the user to instantiate an object from which to extract isotopic distributions. Its parameters are the chemical formula, number of labile bonds num_labile), isotopic enrichment
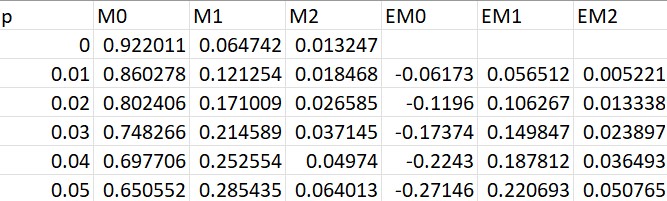
For example, the code below calculates asymptotic enrichments from glutamatic acid labeled with heavy water where
import numpy as np
import pandas as pd

import chemparse

from mida_alg import Abundance
from correction import normalization


formula = 'C5H9NO4'
p_measured = 0.061

formula_dict = chemparse.parse_formula(formula)
formula_input = list(formula_dict.values())

labaled_obj = Abundance(formula_input, num_labile = 4, p = p_measured)
labeled_mid = labeled_obj.get_MID()[0][:3]
labeled_abundance = normalization(nat_abd_mid)

nat_abd_obj = Abundance(formula_input)
nat_abd_mid = nat_abd_obj.get_MID()[0][:3]
natural_abundance = normalization(nat_abd_mid)

enrichments = labeled_abundance - natural_abundance