
- About Me
- Technical Skills
- Python Data Exploration
- Team Projects
- SQL & Database Projects
- JavaScript & Web Development
- Machine Learning
- Tableau & Business Intelligence
- Contact
I'm an Equity Investment Manager and ASU Bootcamp Certified Data Analyst with a passion for transforming complex datasets into actionable insights.
Current Roles:
- AI Data Analyst Contractor - Outlier, Alignerr, Telus International
- Equity Investment Manager - Managing over $5 million in AUM for personal and family clientele
Professional Journey:
My unique career path combines deep financial expertise with cutting-edge data science. I began my career in healthcare information systems at Foothills Radiology Information Services, where I developed a strong foundation in data management and process optimization. This experience led me to transition into trading and investment management, where I've successfully managed multi-million dollar portfolios.
Recently completing ASU's Data Analytics Bootcamp, I've formalized my technical expertise to complement my financial acumen, creating a powerful combination of domain knowledge and technical skills.
Core Competencies:
- Data Analysis & Visualization
- Artificial Intelligence & Machine Learning
- Financial Modeling & Portfolio Management
- Database Design & Management
- Business Intelligence & Strategy
- Full-Stack Development
Currently seeking: Data-driven roles in finance or technology where I can leverage my unique blend of investment expertise, analytical skills, and technical capabilities to drive business outcomes.
| Category | Technologies |
|---|---|
| Programming Languages | Python, JavaScript, SQL |
| Data Analysis | Pandas, NumPy, Matplotlib, Seaborn, SciPy |
| Machine Learning | Scikit-learn, TensorFlow, Keras |
| Databases | MySQL, PostgreSQL, SQLite, MongoDB, SQLAlchemy |
| Data Visualization | Tableau, D3.js, Chart.js, Leaflet.js, Plotly |
| Web Development | HTML, CSS, Flask, RESTful APIs, GeoJSON |
| Tools & Platforms | Git, Jupyter Notebooks, VS Code, GitHub Pages |
Comprehensive analysis of California Fire Data spanning 145 years (1878-2023) using advanced statistical methods and data visualization techniques.
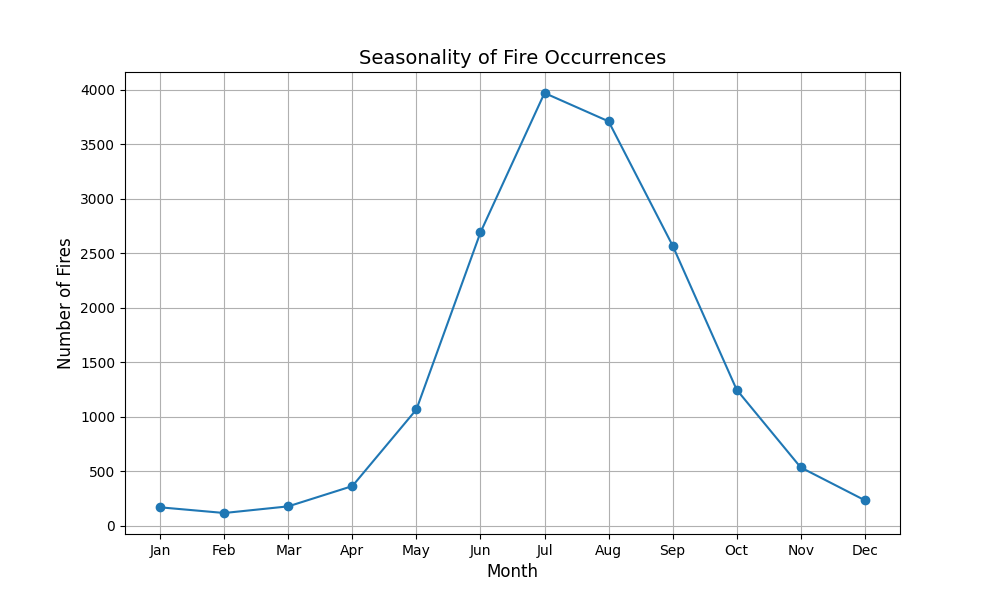
Key Insights:
- Identified seasonal patterns and peak fire occurrence periods
- Analyzed temporal trends showing increasing fire frequency in recent decades
- Evaluated containment effectiveness across different regions and time periods
- Mapped spatial distribution patterns to identify high-risk zones
Technologies: Python, Pandas, Matplotlib, Seaborn, NumPy
In-depth investigation of third-party candidate performance in U.S. Presidential Elections (1978-2020) with statistical analysis of voting patterns and trends.
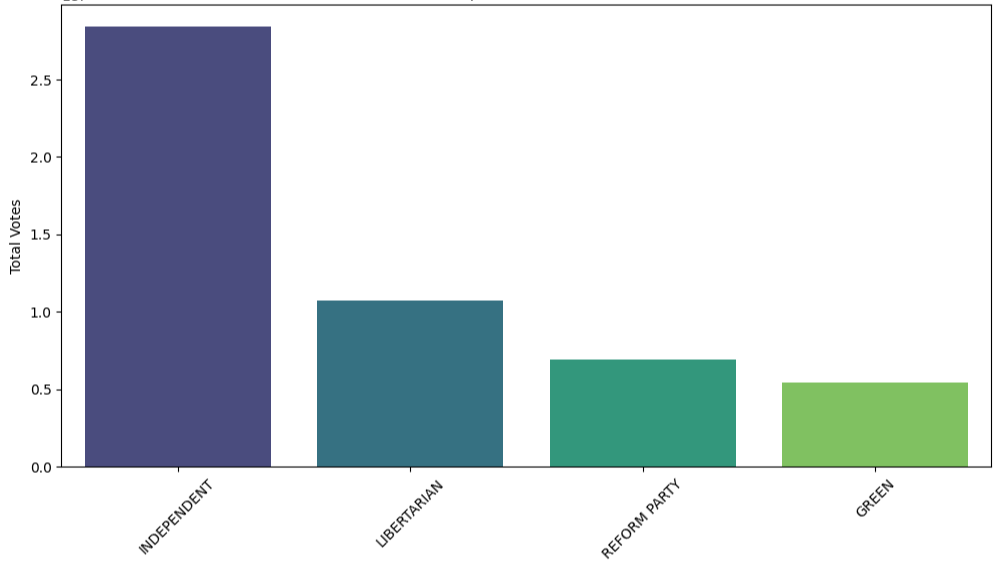
Key Insights:
- Identified top-performing third-party candidates and their electoral impact
- Analyzed correlation between economic conditions and third-party voting
- Tracked voting trends across multiple election cycles
- Examined geographic variations in third-party support
Technologies: Python, Pandas, Matplotlib, Seaborn, Statistical Analysis
Collaborative project analyzing Airbnb listing data to uncover pricing strategies, host behaviors, and market dynamics.
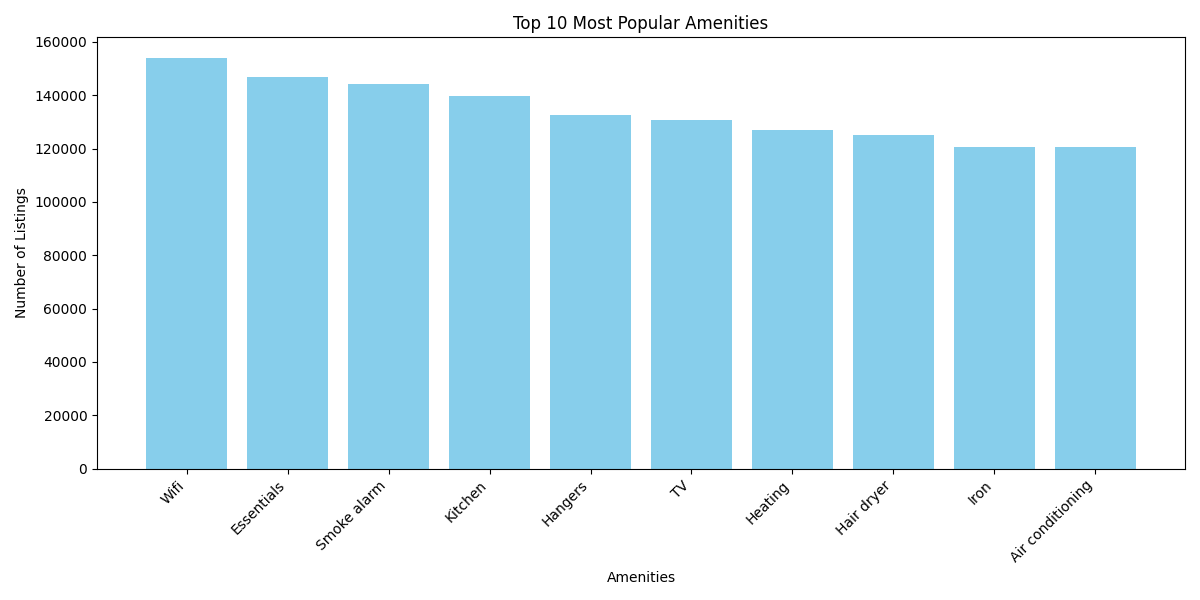
Key Insights:
- Quantified impact of premium amenities on pricing (average 15-30% premium)
- Identified seasonal pricing patterns and occupancy trends
- Analyzed host performance metrics and successful listing strategies
- Conducted statistical hypothesis testing to validate findings
Technologies: Python, Pandas, NumPy, Matplotlib, SciPy, Statistical Libraries
Full-stack data visualization platform exploring global population dynamics and migration patterns with interactive maps and charts.
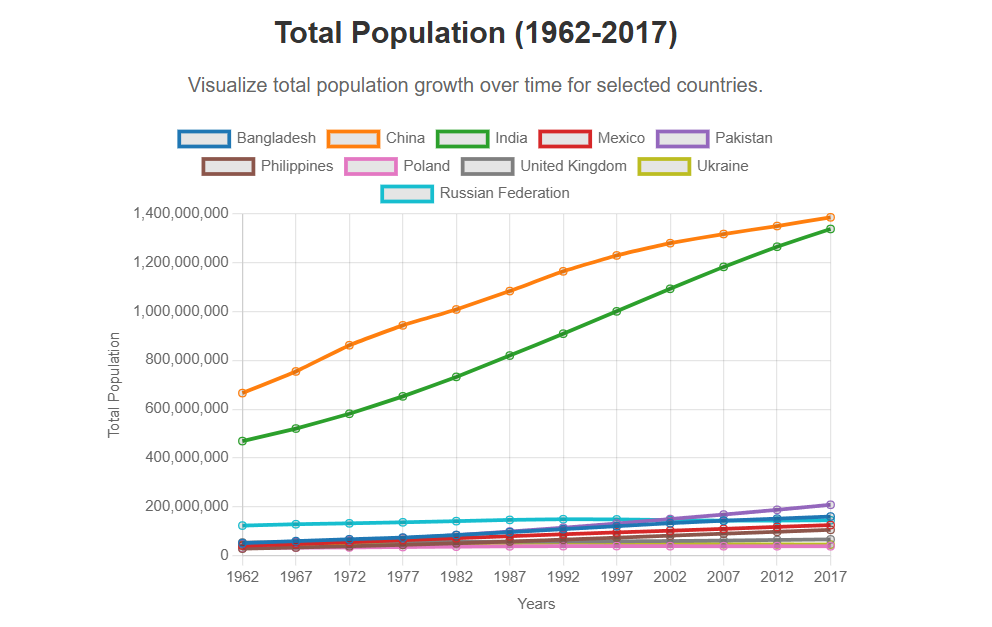
Key Features:
- Interactive choropleth maps showing population density by region
- Dynamic charts displaying migration flows and demographic trends
- MongoDB database integration for efficient data querying
- Responsive web design for cross-device compatibility
Technologies: JavaScript, Chart.js, Leaflet.js, MongoDB, SQL, HTML/CSS
Machine learning classification system designed to identify at-risk students using comprehensive academic, social, and demographic features from Portuguese secondary school data.
Project Highlights:
- Built predictive models achieving 85%+ accuracy in identifying at-risk students
- Analyzed 30+ features including grades, absences, family background, and social factors
- Compared multiple classification algorithms (Random Forest, Logistic Regression, SVM)
- Developed actionable recommendations for early intervention strategies
Technologies: Python, SQLite3, Scikit-learn, Pandas, Data Preprocessing
Comprehensive ETL (Extract, Transform, Load) pipeline for processing and analyzing crowdfunding campaign data with robust database design.
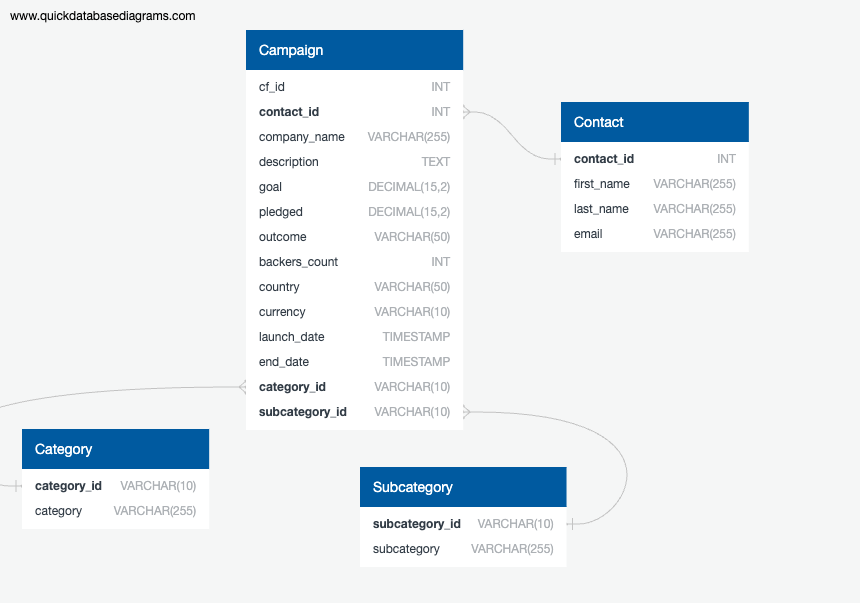
Technical Implementation:
- Designed normalized relational database schema with proper relationships
- Implemented data validation and cleaning procedures
- Created efficient SQL queries for complex analytical questions
- Built automated data transformation workflows using Pandas
Technologies: Python, Pandas, MySQL, ERD Design, SQL
Full-stack application featuring climate data analysis and RESTful API for querying and visualizing Hawaii weather patterns.
Key Features:
- Designed and implemented Flask API with multiple endpoints
- Performed statistical analysis on precipitation and temperature data
- Created dynamic visualizations showing seasonal weather patterns
- Implemented ORM queries using SQLAlchemy for efficient data access
Technologies: Python, SQLAlchemy, Flask, Pandas, Matplotlib, REST APIs
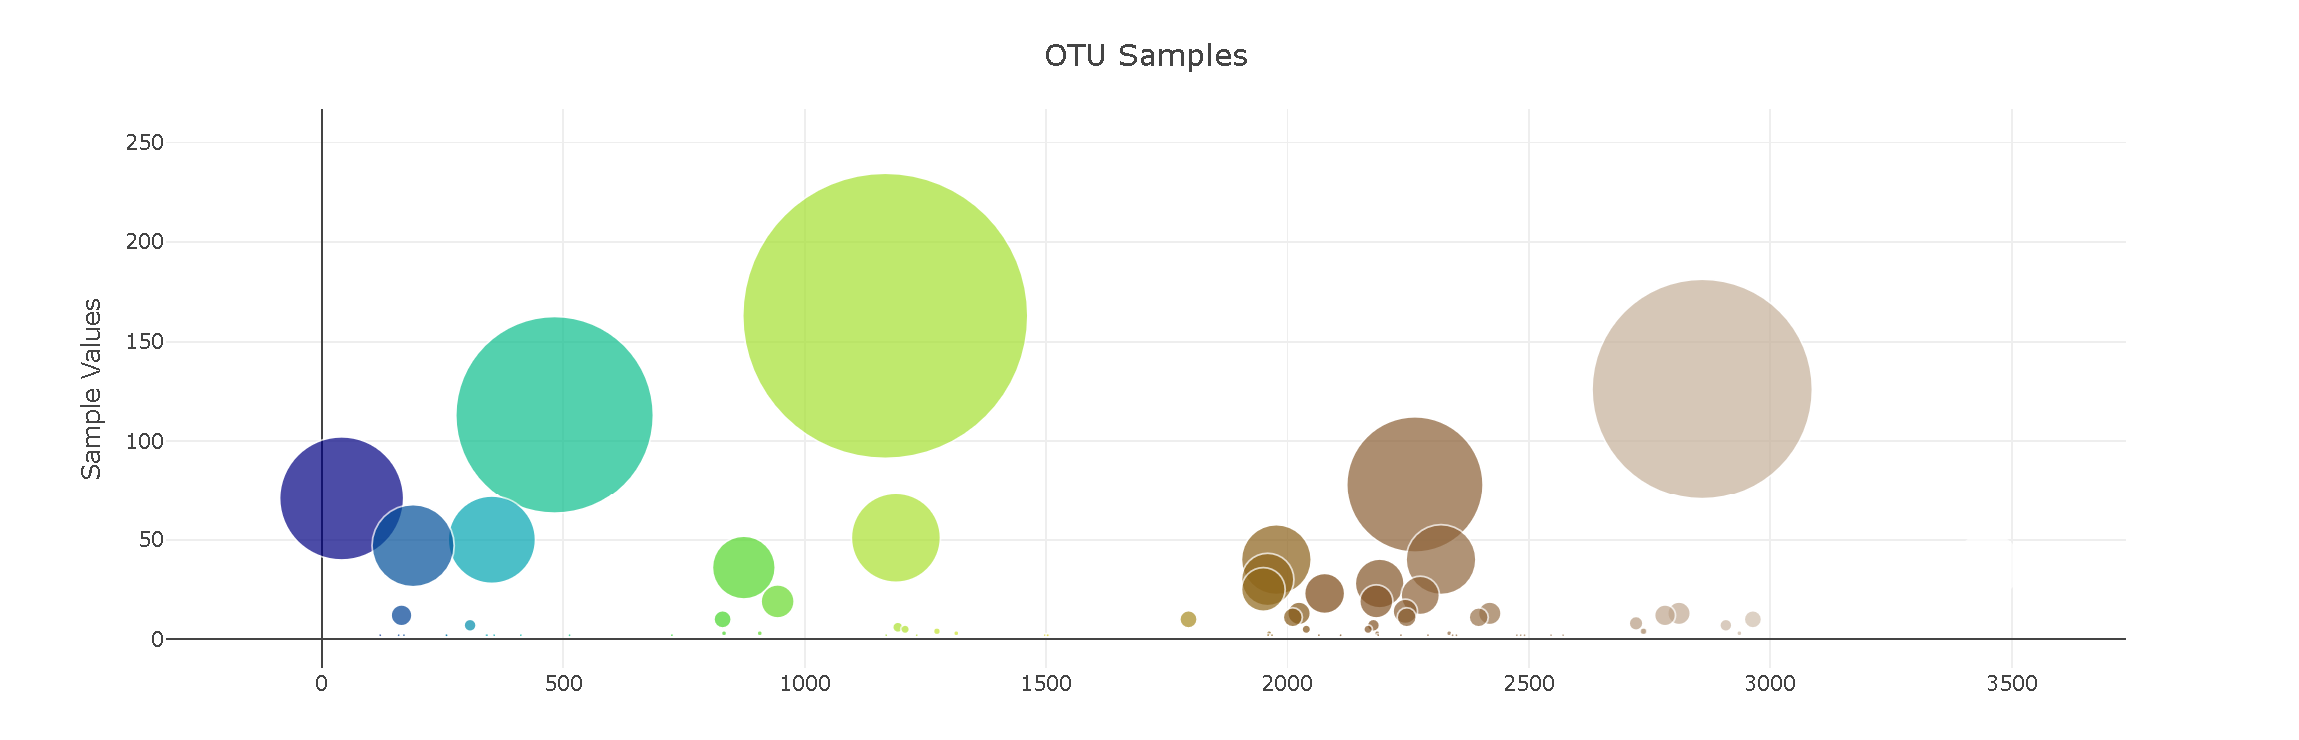
Interactive web application exploring biodiversity in human belly button microbiomes using D3.js and modern JavaScript.
 Click image to view live deployment
Features:
- Dynamic bar charts showing top 10 microbial species per sample
- Interactive bubble charts visualizing bacterial diversity
- Responsive demographic information panel
- Real-time data updates based on user selection
Technologies: JavaScript (ES6+), D3.js, HTML5, CSS3, JSON
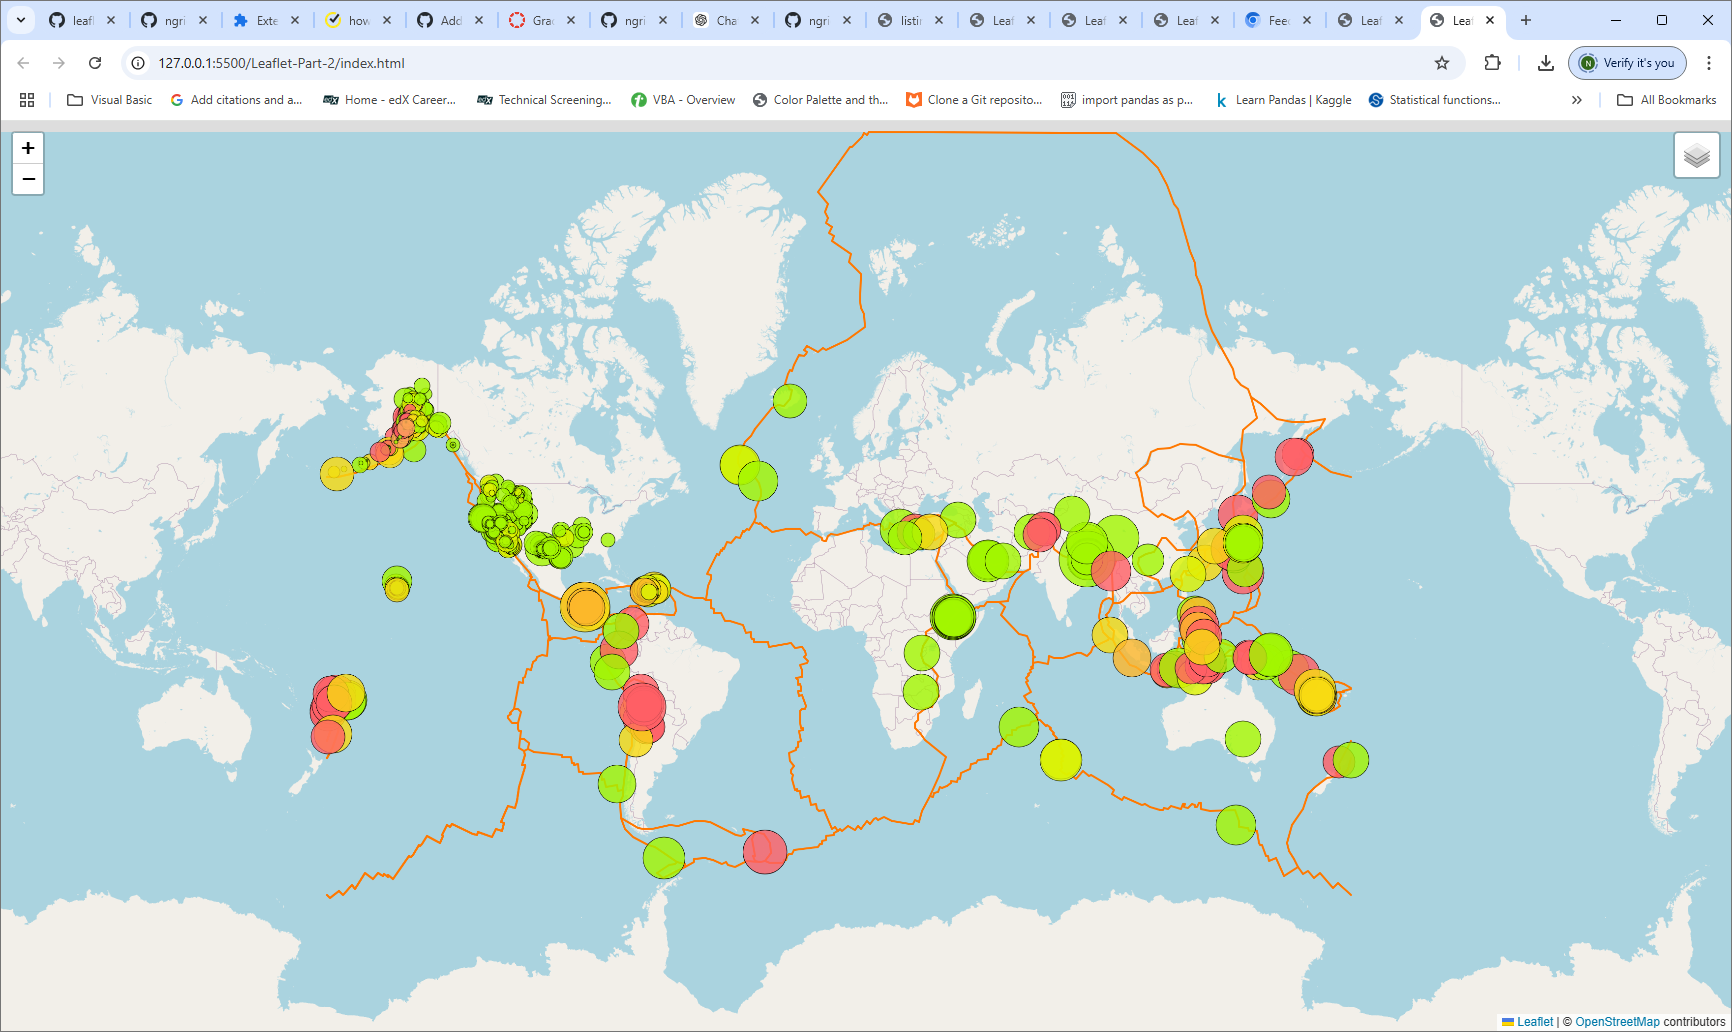
Real-time earthquake visualization platform displaying global seismic activity with interactive mapping and filtering capabilities.
 Click image to view live deployment
Features:
- Interactive map displaying global earthquake data from USGS
- Dynamic markers sized by magnitude and colored by depth
- Tectonic plate boundary overlays
- Multi-layer base maps with toggle controls
- Popup information windows with detailed earthquake data
Technologies: JavaScript, Leaflet.js, GeoJSON, HTML/CSS, USGS API
Applied K-Means clustering and Principal Component Analysis (PCA) to segment cryptocurrencies based on market behavior and trading metrics.
Methodology:
- Preprocessed and normalized cryptocurrency market data (price changes, trading volume)
- Applied elbow method to determine optimal number of clusters (k=4)
- Performed PCA for dimensionality reduction while retaining 90% variance
- Compared clustering results using original vs. PCA-transformed features
- Visualized cluster characteristics to identify distinct crypto asset categories
Business Impact: Identified distinct cryptocurrency market segments enabling portfolio diversification strategies and risk assessment frameworks for digital asset investors.
Technologies: Python, Scikit-learn, K-Means, PCA, Pandas, Matplotlib
Developed binary classification models to predict loan default risk using borrower financial and demographic data.
Model Performance:
- Achieved 95% accuracy in identifying high-risk borrowers
- Precision: 92%, Recall: 89%, F1-Score: 90%
- Implemented class imbalance handling using SMOTE
- Performed feature engineering to improve predictive power
Technical Approach:
- Compared multiple algorithms: Logistic Regression, Decision Trees, Random Forest
- Conducted cross-validation to prevent overfitting
- Analyzed feature importance to identify key risk indicators
- Tuned hyperparameters using GridSearchCV
Technologies: Python, Scikit-learn, Logistic Regression, Decision Trees, Pandas, Imbalanced-learn
Built linear regression models to predict residential property values using comprehensive housing market data.
Project Scope:
- Analyzed 21,000+ home sales records with 20+ features
- Performed extensive feature engineering (property age, renovation status, location factors)
- Implemented multiple regression techniques (Linear, Ridge, Lasso)
- Created data visualizations showing price distributions and correlations
Key Findings:
- Square footage, location (zip code), and condition are strongest price predictors
- Waterfront properties command 2-3x premium on average
- Model achieved R² = 0.85, MAE = $125,000
Technologies: Python, Scikit-learn, Pandas, Seaborn, Linear Regression, Statistical Analysis
Designed and trained a deep neural network to predict employee attrition using HR metrics and organizational data.
Neural Network Architecture:
- Input layer: 20 normalized features
- Hidden layers: 3 layers with 128, 64, and 32 neurons respectively
- Activation: ReLU for hidden layers, Sigmoid for output
- Dropout layers (0.3) to prevent overfitting
Training & Optimization:
- Implemented early stopping monitoring validation loss
- Applied batch normalization for training stability
- Used Adam optimizer with learning rate scheduling
- Achieved 87% accuracy after hyperparameter tuning
Business Application: Model enables HR departments to identify at-risk employees early, allowing for proactive retention strategies and reducing turnover costs.
Technologies: Python, TensorFlow, Keras, Neural Networks, Deep Learning, Pandas
Interactive Tableau story analyzing New York City bike-sharing patterns, user demographics, and operational insights.
Dashboard Features:
- Geographic heatmaps showing popular stations and routes
- Time-series analysis of ridership patterns (hourly, daily, seasonal)
- User demographic breakdowns (subscribers vs. customers, age groups)
- Trip duration distributions and distance analysis
- Peak usage time identification for operational planning
Data Pipeline:
- Python data cleaning and preprocessing of 1M+ trip records
- Feature engineering for time-based analysis
- Aggregation and statistical calculations
- Export to Tableau-optimized format
Business Insights:
- Identified peak commute times for station capacity planning
- Analyzed seasonal trends to optimize bike redistribution
- Segmented user types for targeted marketing strategies
Technologies: Tableau Public, Python, Pandas, Data Visualization, Storytelling
I'm excited to connect with fellow data enthusiasts, potential employers, and collaborators!
Get in touch:
- Email: ntrief@gmail.com
- LinkedIn: linkedin.com/in/nathaniel-trief-492a70b/
- GitHub: github.com/ngrief
Open to:
- Full-time data analyst/scientist positions
- Contract/consulting opportunities
- Collaborative projects
- Speaking engagements
- Mentorship opportunities
Let's create something amazing with data!
Last Updated: September 2025