Example and sample data
On this tutorial are shown two EvoMining examples.
- Utilizing default data, EvoMining web interface functionality is explained.
- Use of custom input databases is exemplified with sample data. To learn more about how to construct the databases consult the databases site.
start EvoMining on the prompt of the docker image with the default data by typing:
perl startEvoMining.pl
Once the script finished, start EvoMining web pipeline on firefox or any browser at the adress:
http://localhost/html/EvoMining/index.html.
When in doubt about how to launch EvoMining docker, consult Installation.
This should be the welcome screen, press the start button to initialize the web interface.

On a second screen EvoMining requires the e-value required to consider a sequence inside a family, default:0.001. Press submit button to launch the expansions script that for each enzymatic family identifies sequences belonging to the expanded family.

A heatmap table is presented to the user once the expanded family has been gathered. Organisms are distributed on the rows of the table. Each column represents an enzyme family. When an organism has a copy number above the average plus one standard deviation on one particular enzyme family, the correspondent square is filled in red, representing an expansion of that enzyme family on that particular organism. Once the heatmap is finished, continue to the search of genes of the family that has been recruited onto natural product biosynthetic gene clusters, press the submit button.

On this case, a table presents for each family its known recruitments into natural product (NPs) biosynthetic gene clusters. Metadata from MI-BiG such as type of natural product and taxonomy of the producer organism are shown. Select an enzyme family to continue into a phylogenetic reconstruction.

Once the phylogenetic history of an expanded family has been done, after alignment and curation, trees that were able to finish are shown. Select a tree and send it to the visualization interface.

Tree visualization integrates zooming and panning when trees are under mouse click. This characteristic allows to perform a detailed tree exploration. Trees are interactive in the sense that leaves can be clicked in and send it to context visualization to compare its genomic contexts. Context visualization displays on a tooltip metadata derived from RAST functional anotation. Trees are scalable vector graph (svg) files that remain available on you local directory.
This is an example of a tree coming from a family that has not been recruited. Phosphoserine aminotransferase the third enzyme from 3PGA aminoacid pathway is present mainly as a single copy on this set of organisms, this family has not been expanded on this example database. Recruitments from MI-BiG are not present on this tree, and there are not experimental evidence from MI-BiG that there are copies of this family devoted to secondary metabolism. Sequences used as seeds on the central-DB are orange colored, Best Bidirectional hits (BBH) of the seeds are red marked. The tree shows a leave marked on cyan, this color corresponds to the optional antiSMASH database, i.e. those copies that has been identified by antiSMASH software as candidate to belong to a BGC.

Metadata like organism name and gene id are displayed on tree leaves when mouseover.
This example corresponds to the Phosphoglycerate dehydrogenase, the first enzyme from the 3PGA aminoacid pathway. In contrast with the previous non expanded tree, Phosphoglycerate dehydrogenase tree posses an expanded family showing MI-BiG evidence that has been recruited multiple times into NPs metabolism. In addition to antismash (blue) and central colored copies: seeds (orange) and BBH (red), MI-BiG copies of this family are blue colored and all those leaves close to an MI-BiG mark that do not belong to the central family (red colored) and are not recognized by antiSMASH (cyan) are the EvoMining predictions (green).

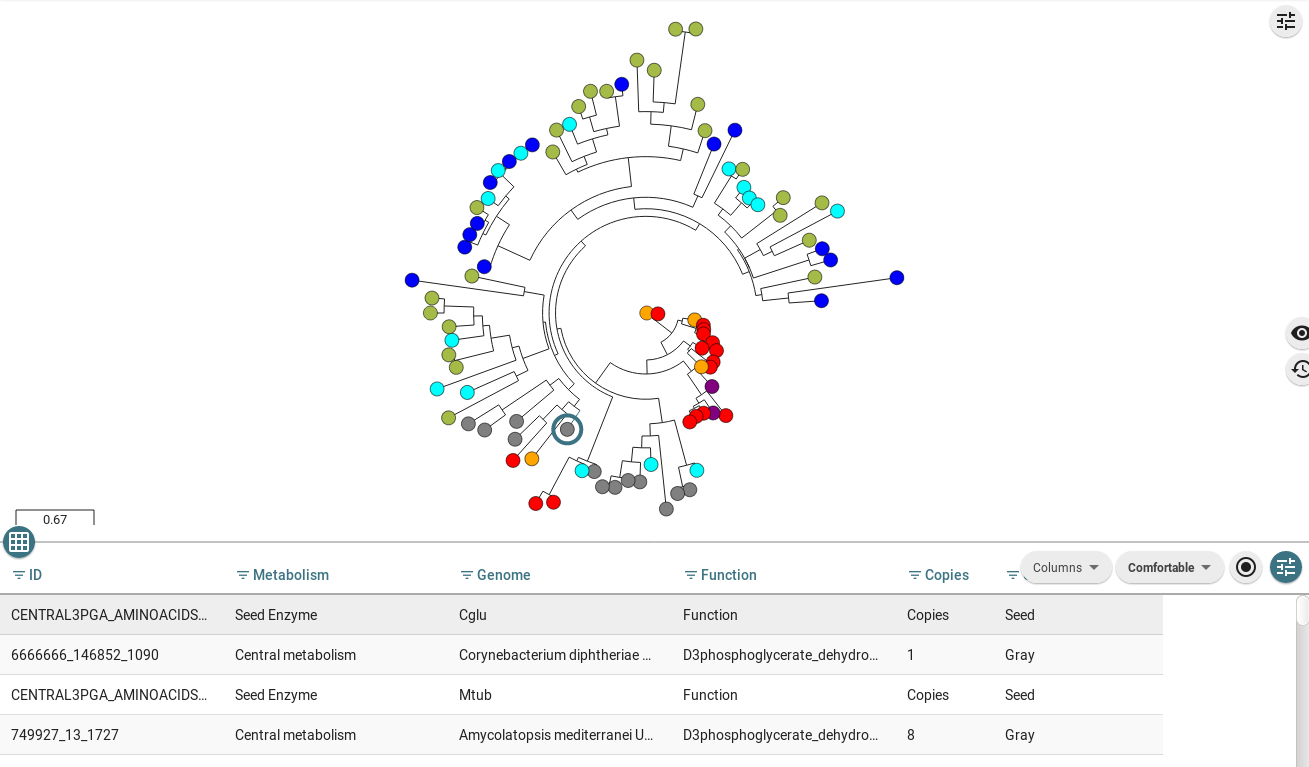
On this tree there are also non colored leaves, this sequences are not BBH of the central database. Black branches could correspond to novel natural products non previously known by MI-BIG or may be diverging into another metabolic destiny.
Genomic context of selected genes are shown below. Metadata from RAST functional anotation are displayed on a tooltip when mouseover.
Trees are compatible with MicroReact svg and nwk EvoMining output can be uploaded to MicroReact to obtain visualization like this MicroeReact EvoMining example
Results are stored at your local directory on the subdirectory
ALL_curado.fasta_MiBIG_DB.faa_los17
This part explains how to use databases introduced by the user, for that purpose this sample data will be used.
- Open a terminal and place your self on a local directory.
$ cd </path/to/mydirectory>
On the local prompt the starting character is $ on the docker prompt is #.
Get data:
curl https://zenodo.org/record/1219709/files/SampleData.tar.gz?download=1 > SampleData.tar.gz && tar -xzf SampleData.tar.gz
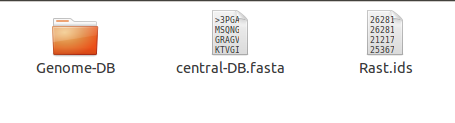
Input sample data contains:
| File | Description |
|---|---|
| Genome-DB | Directory with the genome database |
| Rast.ids | Tab separated File with genome Names/Ids |
| central-DB.fasta | Central database file (fasta) |
| natural-DB.fasta | Natural products database |
and should look like:
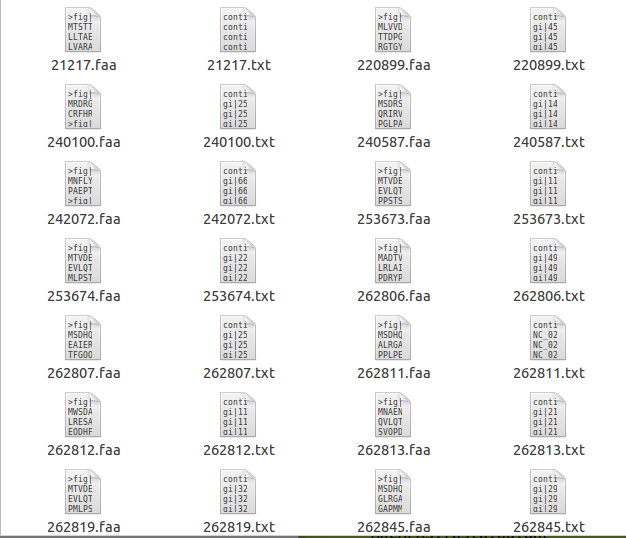
Genome Database:
Users data:
If you have genomes annotated in RAST, first add your genome To the RAST ID file
then add the aminoacids (JobId.faa) and table_txt (JobId.txt) files to the Genome-DB directory.
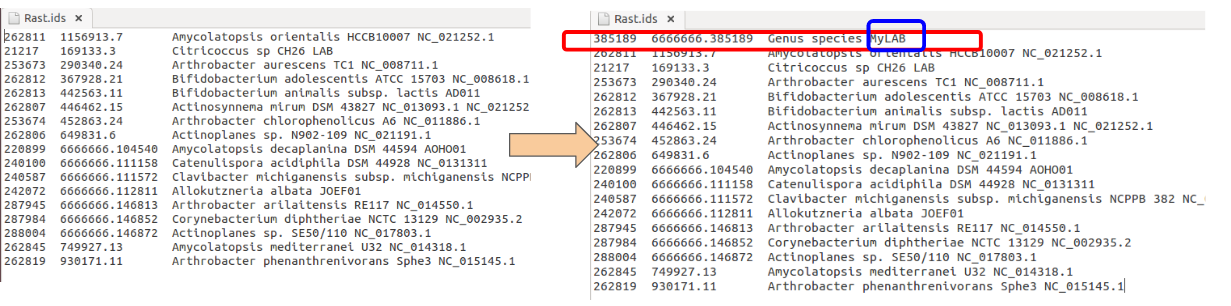
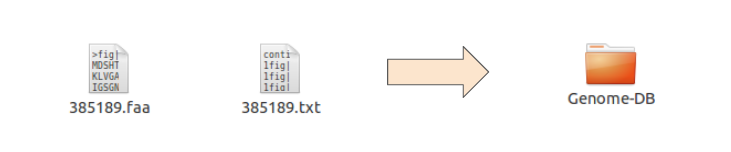
To download and upload Rast files in batch cehck my Rast docker image.
- Start EvoMining docker image.
$ docker run -i -t -v $(pwd):/var/www/html/EvoMining/exchange -p 80:80 nselem/newevomining:latest /bin/bash
At this time the local directory /path/to/mydirectory and docker directory /var/www/html/EvoMining/exchange are shared.
- Move the sample data from the EvoMining docker into your local machine directory:
-Check that the data are correctly at your directory
$ ls /path/to/mydirectory
Genome-DB Rast.ids natural-DB.fasta
-
Start EvoMining with non default databases
# perl startEvoMining.pl -g Genome-DB -c central-DB.fasta -n natural-DB.fasta -r Rast.ids
This command starts EvoMining using as central-DB the file central-DB.fasta, as natural-DB natural-DB.fasta and as genome DB the genomes contained on the directory los17. It also needs the file los17Rast.ids that containes for each genome its name and its corresponding RAST id. To know more about how to construct you own databases consult Databases Conformation -
EvoMining browser
Open EvoMining web interface and follow the steps as on the prior example. -
Results
Results e.g. trees and alignments will be stored at/path/to/mydirectoryon the directory:
<central-DB>/<natural-DB>/<genome-DB>on this case this information correspondes to:
central-DB.fasta_natural-DB.fasta_los17
