Hi, thanks nutonomy provide a wonderful dataset.
I am trying to visualize "road segment" in Singapore Queenstown's map, but get a broken results.
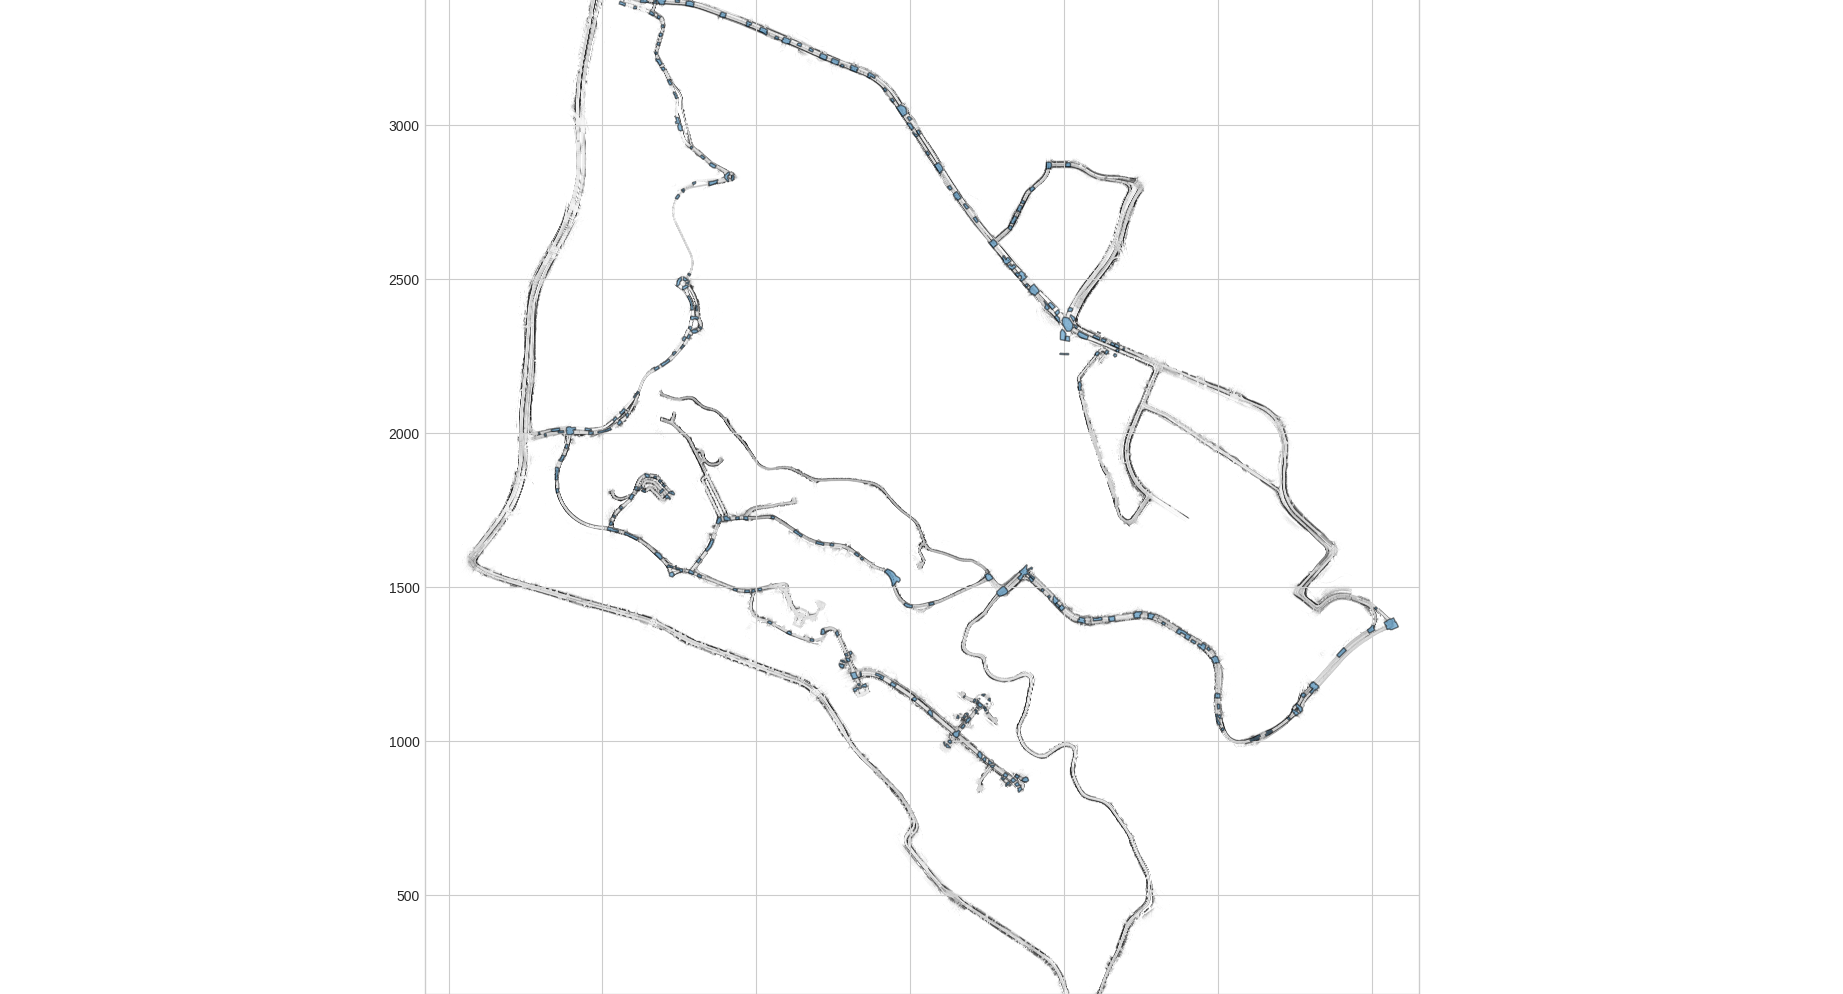
I check the Singapore Queenstown map's json file. In my opinion, it seems lack of data.
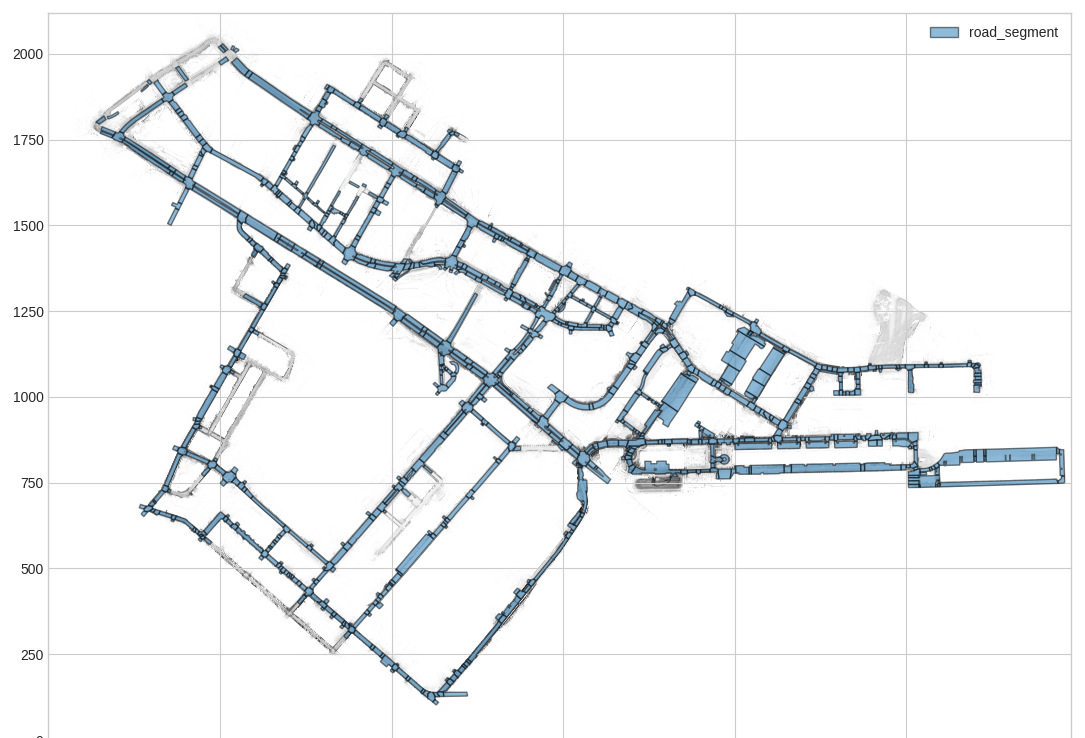
I also visualize "road segment" in Boston Seaport's map and get a nice results.
Here is my code
from nuscenes.nuscenes import NuScenes
from nuscenes.map_expansion.map_api import NuScenesMap
from nuscenes.map_expansion.bitmap import BitMap
from nuscenes.map_expansion import arcline_path_utils

import matplotlib.pyplot as plt

nusc_map = NuScenesMap(dataroot='/data/sets/nuscenes', map_name='singapore-queenstown')
nusc = NuScenes(version='v1.0-mini', dataroot='/data/sets/nuscenes', verbose=True)
bitmap = BitMap(nusc_map.dataroot, nusc_map.map_name, 'basemap')
fig, ax = nusc_map.render_layers(['road_segment'], figsize=1, bitmap=bitmap)
plt.show()
Do I neglect anything or it just has incomplete data?
Hi, thanks nutonomy provide a wonderful dataset.


I am trying to visualize "road segment" in Singapore Queenstown's map, but get a broken results.
I check the Singapore Queenstown map's json file. In my opinion, it seems lack of data.
I also visualize "road segment" in Boston Seaport's map and get a nice results.
Here is my code
Do I neglect anything or it just has incomplete data?