On several of my deployed environments, the origin master process has excessive permanent CPU usage (around 100%) even if the cluster should be mostly idle (no pod changes).
Version
oc v3.6.1+008f2d5
kubernetes v1.6.1+5115d708d7
features: Basic-Auth GSSAPI Kerberos SPNEGO

Server https://XXXXXXXXXXXXXXX:8443
openshift v3.6.1+008f2d5
kubernetes v1.6.1+5115d708d7
Steps To Reproduce
Happens on 3 of my environments, but not on others. On one of them, the bug started showing after I reconfigured the environment to use mandatory http proxies but I doubt that proxies are responsible for the high CPU usage.
Current Result
In top, the origin master process permanently uses around 100% CPU and the system load has a floor of 1 or so.
Expected Result
The host should not be loaded and origin master CPU usage should be at 15% or less during normal activity.
Additional Information
Our environments do not have too many pods, typical number is between 50 (test environment in one VM/host) to around 250 pods (production environment on several physical hosts).
Typical top first lines:
top - 08:59:01 up 79 days, 31 min,  2 users,  load average: 3.20, 2.17, 1.57
Tasks: 1944 total,   2 running, 586 sleeping,   0 stopped,   1 zombie
%Cpu(s): 27.7 us, 15.3 sy,  0.1 ni, 56.6 id,  0.1 wa,  0.0 hi,  0.3 si,  0.0 st
KiB Mem : 13201092+total, 10554044+free, 14012704 used, 12457768 buff/cache
KiB Swap:  1679356 total,  1599228 free,    80128 used. 11526048+avail Mem

   PID USER      PR  NI    VIRT    RES    SHR S  %CPU %MEM     TIME+ COMMAND
110627 root      20   0 12.668g 727016 114860 S  74.0  0.6  64:10.95 /usr/bin/openshift start master --config=/etc/origin/master/master-config.yaml --loglevel=2
 57109 root      20   0 2080192 408432  88672 S  59.2  0.3 300:00.89 /usr/bin/openshift start node --config=/etc/origin/node/node-config.yaml --loglevel=2
 47765 1000060+  20   0 1876608 1.721g  25136 S  41.1  1.4 241:12.29 /bin/prometheus -storage.local.retention=720h -storage.local.target-heap-size=2863311530 -storage.local.path=/data -config.file=/etc/prometheus/prometheus.yml -web.external-url=https://prometheus-moni+
 45836 1000050+  20   0 6939612 465012  18852 S   9.9  0.4  70:48.93 /bin/java -Xms256m -Xmx1g -Djava.awt.headless=true -XX:+UseParNewGC -XX:+UseConcMarkSweepGC -XX:CMSInitiatingOccupancyFraction=75 -XX:+UseCMSInitiatingOccupancyOnly -XX:+HeapDumpOnOutOfMemoryError -XX+
Strace output, lots of futex-related calls like this:
select(0, NULL, NULL, NULL, {0, 3})     = 0 (Timeout)
futex(0xc0023f0, FUTEX_WAIT, 0, NULL)   = -1 EAGAIN (Resource temporarily unavailable)
futex(0xbffe0f8, FUTEX_WAKE, 1)         = 1
futex(0xbffe0e0, FUTEX_WAKE, 1)         = 1
futex(0xbffe0f8, FUTEX_WAKE, 1)         = 1
futex(0xbffe0e0, FUTEX_WAKE, 1)         = 1
futex(0xbffe0f8, FUTEX_WAKE, 1)         = 1
Journal of origin-master.service at loglevel 5 does not say much except that it syncs statefulsets every 30s or so:
Apr 06 09:01:08 openshift-host origin-master[110627]: I0406 09:01:08.676936  110627 rest.go:324] Starting watch for /api/v1/namespaces, rv=23227 labels= fields= timeout=5m54s
Apr 06 09:01:14 openshift-host origin-master[110627]: I0406 09:01:14.738307  110627 rest.go:324] Starting watch for /api/v1/resourcequotas, rv=23227 labels= fields= timeout=6m50s
Apr 06 09:01:18 openshift-host origin-master[110627]: I0406 09:01:18.927080  110627 rest.go:324] Starting watch for /api/v1/services, rv=23227 labels= fields= timeout=5m50s
Apr 06 09:01:21 openshift-host origin-master[110627]: I0406 09:01:21.831669  110627 stateful_set.go:420] Syncing StatefulSet backends/redis-wisdom2-sentinel with 1 pods
Apr 06 09:01:21 openshift-host origin-master[110627]: I0406 09:01:21.831736  110627 stateful_set.go:425] Succesfully synced StatefulSet backends/redis-wisdom2-sentinel successful
Apr 06 09:01:21 openshift-host origin-master[110627]: I0406 09:01:21.831771  110627 stateful_set.go:420] Syncing StatefulSet backends/redis-se with 1 pods
Apr 06 09:01:21 openshift-host origin-master[110627]: I0406 09:01:21.831785  110627 stateful_set.go:425] Succesfully synced StatefulSet backends/redis-se successful
Apr 06 09:01:21 openshift-host origin-master[110627]: I0406 09:01:21.831812  110627 stateful_set.go:420] Syncing StatefulSet backends/redis-se-sentinel with 1 pods
Apr 06 09:01:21 openshift-host origin-master[110627]: I0406 09:01:21.831824  110627 stateful_set.go:425] Succesfully synced StatefulSet backends/redis-se-sentinel successful
Apr 06 09:01:21 openshift-host origin-master[110627]: I0406 09:01:21.831847  110627 stateful_set.go:420] Syncing StatefulSet backends/redis-sidekiq with 1 pods
Apr 06 09:01:21 openshift-host origin-master[110627]: I0406 09:01:21.831860  110627 stateful_set.go:425] Succesfully synced StatefulSet backends/redis-sidekiq successful
Apr 06 09:01:21 openshift-host origin-master[110627]: I0406 09:01:21.831883  110627 stateful_set.go:420] Syncing StatefulSet backends/redis-wisdom2 with 1 pods
Apr 06 09:01:21 openshift-host origin-master[110627]: I0406 09:01:21.831895  110627 stateful_set.go:425] Succesfully synced StatefulSet backends/redis-wisdom2 successful
Apr 06 09:01:21 openshift-host origin-master[110627]: I0406 09:01:21.831919  110627 stateful_set.go:420] Syncing StatefulSet backends/graphdb with 1 pods
Apr 06 09:01:21 openshift-host origin-master[110627]: I0406 09:01:21.831932  110627 stateful_set.go:425] Succesfully synced StatefulSet backends/graphdb successful
Apr 06 09:01:21 openshift-host origin-master[110627]: I0406 09:01:21.831956  110627 stateful_set.go:420] Syncing StatefulSet backends/elasticsearch with 1 pods
Apr 06 09:01:21 openshift-host origin-master[110627]: I0406 09:01:21.831968  110627 stateful_set.go:425] Succesfully synced StatefulSet backends/elasticsearch successful
Apr 06 09:01:21 openshift-host origin-master[110627]: I0406 09:01:21.831990  110627 stateful_set.go:420] Syncing StatefulSet backends/mysql with 1 pods
Apr 06 09:01:21 openshift-host origin-master[110627]: I0406 09:01:21.832003  110627 stateful_set.go:425] Succesfully synced StatefulSet backends/mysql successful
Apr 06 09:01:21 openshift-host origin-master[110627]: I0406 09:01:21.832026  110627 stateful_set.go:420] Syncing StatefulSet backends/rabbitmq with 1 pods
Apr 06 09:01:21 openshift-host origin-master[110627]: I0406 09:01:21.832038  110627 stateful_set.go:425] Succesfully synced StatefulSet backends/rabbitmq successful
Apr 06 09:01:21 openshift-host origin-master[110627]: I0406 09:01:21.832061  110627 stateful_set.go:420] Syncing StatefulSet backends/redis-sidekiq-sentinel with 1 pods
Apr 06 09:01:21 openshift-host origin-master[110627]: I0406 09:01:21.832082  110627 stateful_set.go:425] Succesfully synced StatefulSet backends/redis-sidekiq-sentinel successful
Apr 06 09:01:21 openshift-host origin-master[110627]: I0406 09:01:21.832114  110627 stateful_set.go:420] Syncing StatefulSet backends/mongodb with 1 pods
Apr 06 09:01:21 openshift-host origin-master[110627]: I0406 09:01:21.832126  110627 stateful_set.go:425] Succesfully synced StatefulSet backends/mongodb successful
Apr 06 09:01:23 openshift-host origin-master[110627]: I0406 09:01:23.947883  110627 rest.go:324] Starting watch for /oapi/v1/hostsubnets, rv=23227 labels= fields= timeout=6m11s
Apr 06 09:01:25 openshift-host origin-master[110627]: I0406 09:01:25.163958  110627 rest.go:324] Starting watch for /api/v1/namespaces, rv=23227 labels= fields= timeout=8m18s
Apr 06 09:01:25 openshift-host origin-master[110627]: I0406 09:01:25.184510  110627 rest.go:324] Starting watch for /api/v1/pods, rv=23244 labels= fields= timeout=7m15s
pprof.rb cpu profile has more than 50% of time spent in runtime.futex:
$ export PPROF_BINARY_PATH=$PWD ; go tool pprof  http://localhost:6060/debug/pprof/profile?debug=1
Fetching profile over HTTP from http://localhost:6060/debug/pprof/profile?debug=1
Saved profile in /home/julien/pprof/pprof.openshift.samples.cpu.009.pb.gz
File: openshift
Type: cpu
Entering interactive mode (type "help" for commands, "o" for options)
(pprof) top
Showing nodes accounting for 14.28s, 67.07% of 21.29s total
Dropped 659 nodes (cum <= 0.11s)
Showing top 10 nodes out of 130
      flat  flat%   sum%        cum   cum%
    10.61s 49.84% 49.84%     10.61s 49.84%  runtime.futex
     1.01s  4.74% 54.58%      1.01s  4.74%  runtime/internal/atomic.Xchg
     0.77s  3.62% 58.20%      0.77s  3.62%  runtime.usleep
     0.41s  1.93% 60.12%      0.61s  2.87%  runtime.mallocgc
     0.31s  1.46% 61.58%      1.48s  6.95%  runtime.gentraceback
     0.28s  1.32% 62.89%      0.88s  4.13%  runtime.pcvalue
     0.24s  1.13% 64.02%      0.24s  1.13%  runtime.readvarint
     0.22s  1.03% 65.05%      0.23s  1.08%  runtime.findfunc
     0.22s  1.03% 66.09%      0.32s  1.50%  runtime.runqempty
     0.21s  0.99% 67.07%      0.45s  2.11%  runtime.step
(pprof)
The full pprof cpu graph is shown here: 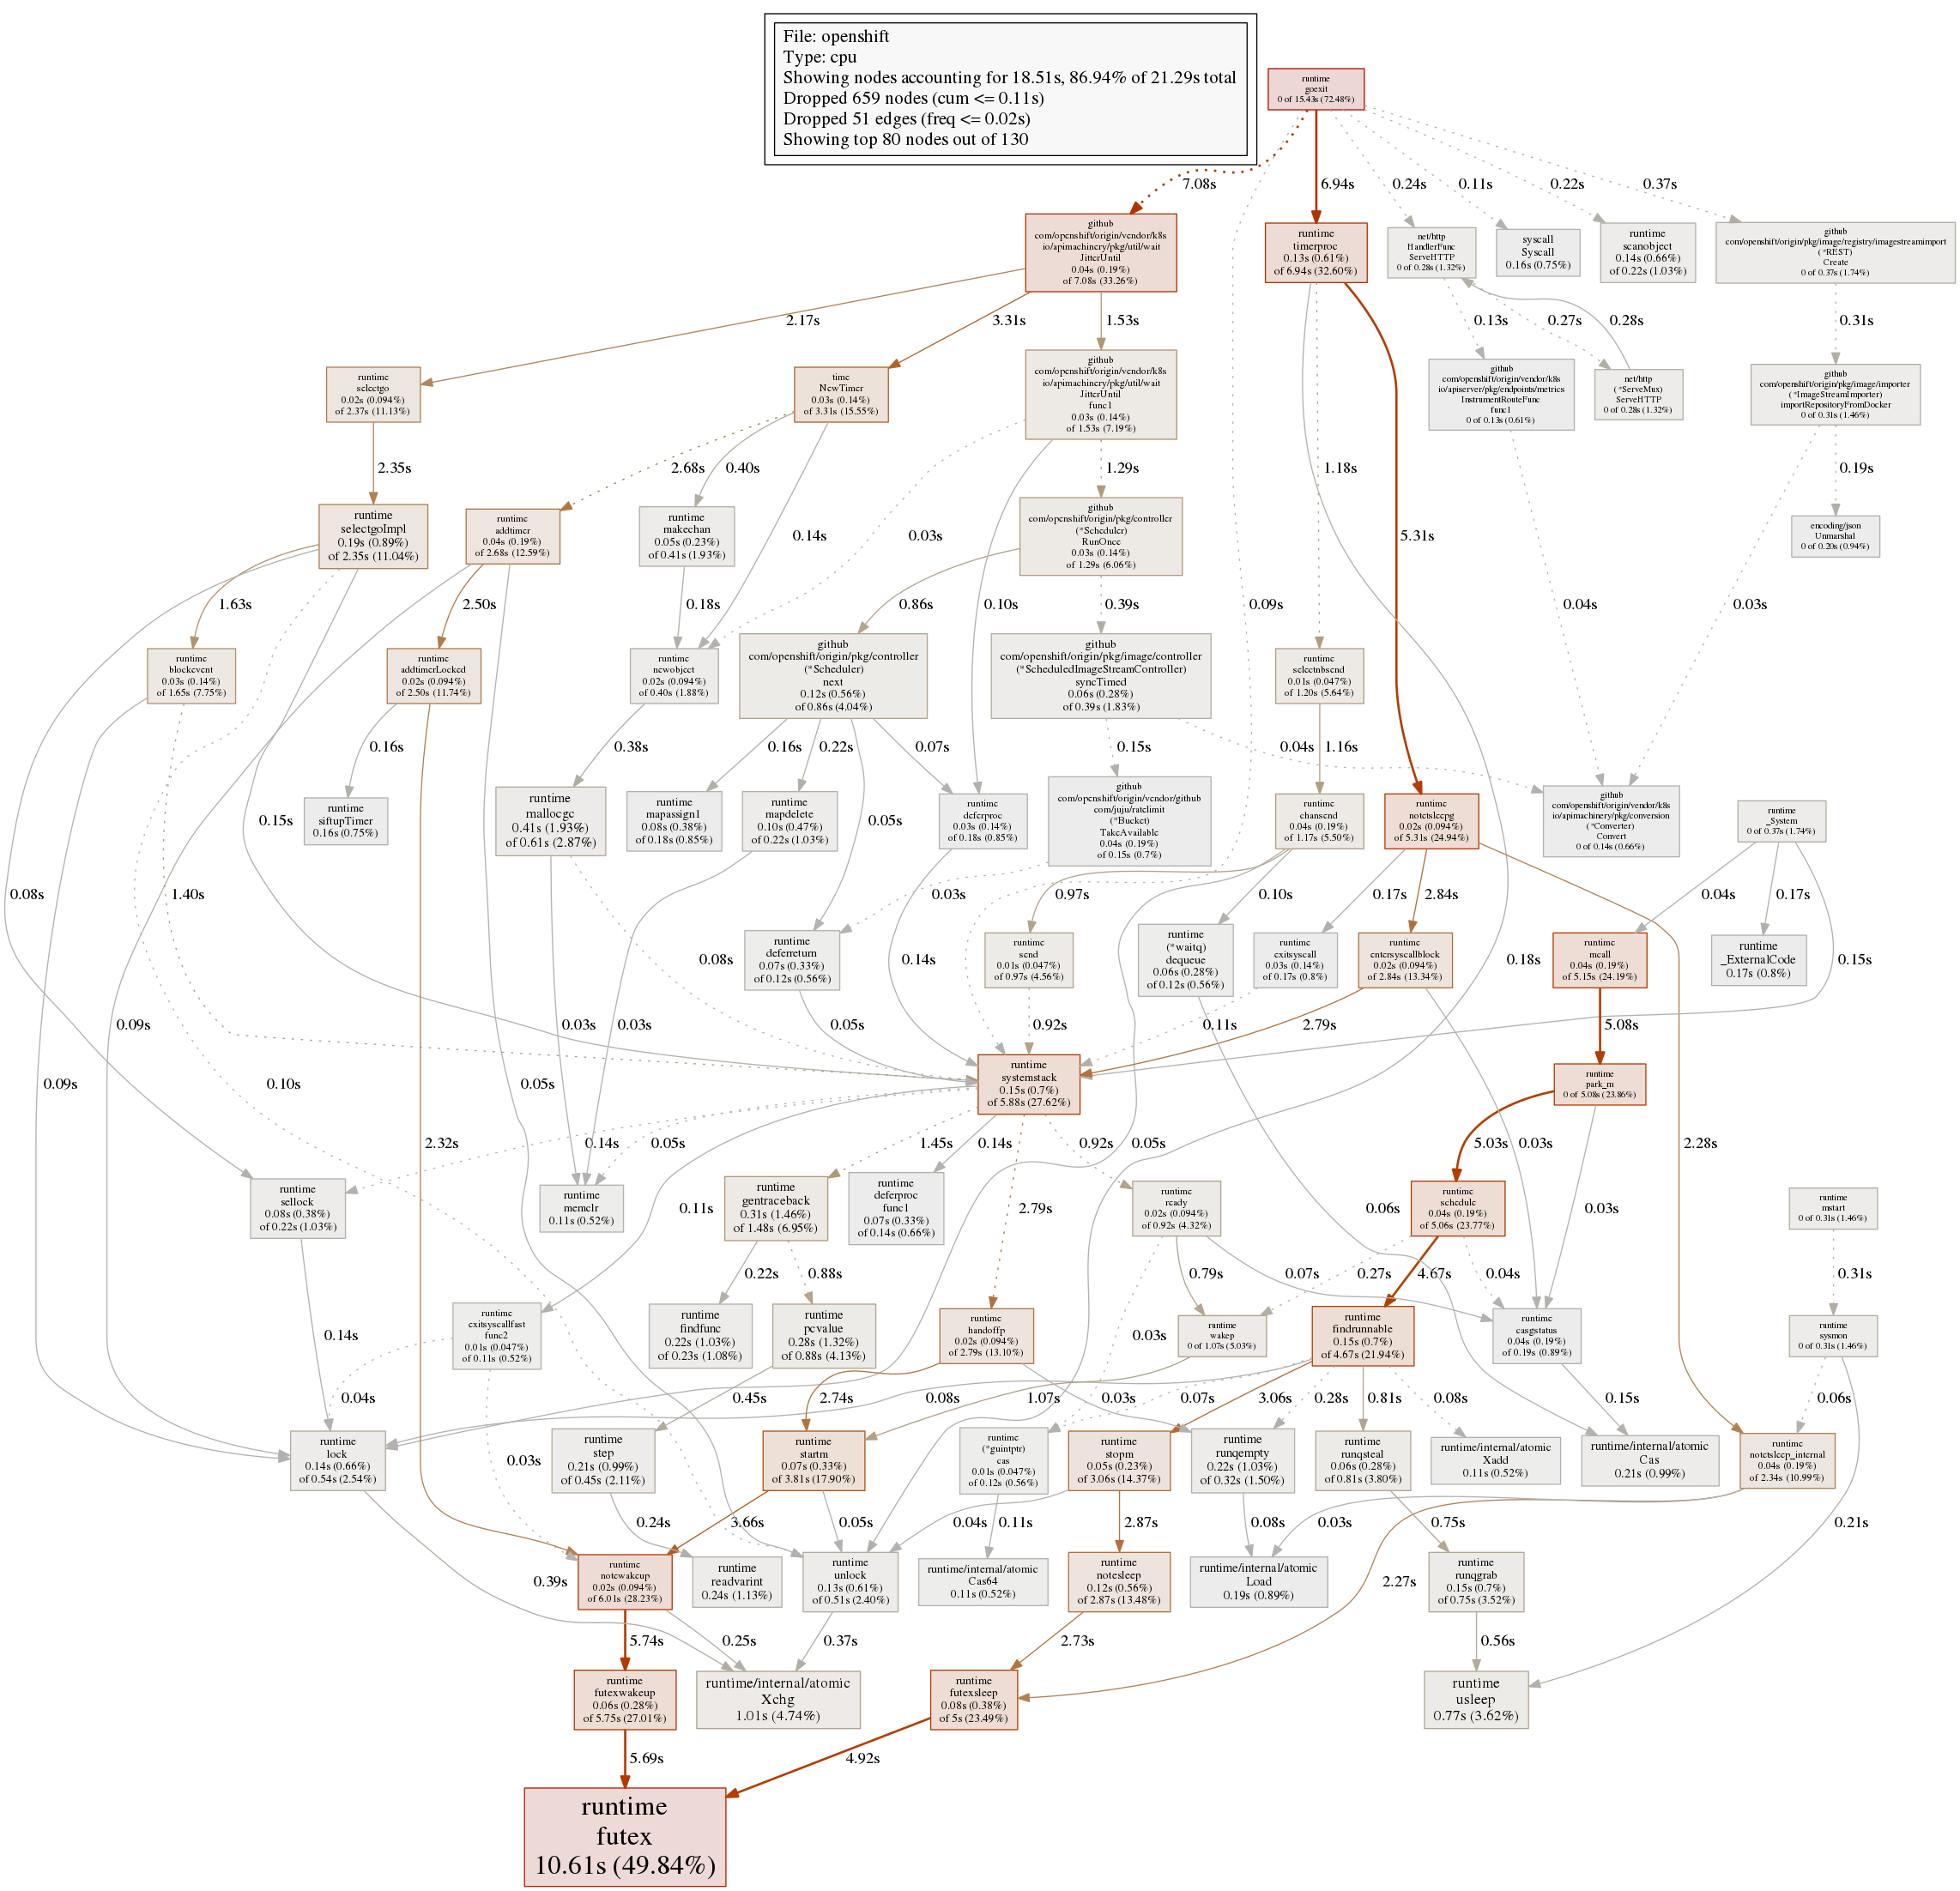
On several of my deployed environments, the
origin master processhas excessive permanent CPU usage (around 100%) even if the cluster should be mostly idle (no pod changes).Version
Steps To Reproduce
Happens on 3 of my environments, but not on others. On one of them, the bug started showing after I reconfigured the environment to use mandatory http proxies but I doubt that proxies are responsible for the high CPU usage.
Current Result
In
top, theorigin masterprocess permanently uses around 100% CPU and the system load has a floor of 1 or so.Expected Result
The host should not be loaded and
origin masterCPU usage should be at 15% or less during normal activity.Additional Information
Our environments do not have too many pods, typical number is between 50 (test environment in one VM/host) to around 250 pods (production environment on several physical hosts).
Typical top first lines:
top - 08:59:01 up 79 days, 31 min, 2 users, load average: 3.20, 2.17, 1.57 Tasks: 1944 total, 2 running, 586 sleeping, 0 stopped, 1 zombie %Cpu(s): 27.7 us, 15.3 sy, 0.1 ni, 56.6 id, 0.1 wa, 0.0 hi, 0.3 si, 0.0 st KiB Mem : 13201092+total, 10554044+free, 14012704 used, 12457768 buff/cache KiB Swap: 1679356 total, 1599228 free, 80128 used. 11526048+avail Mem PID USER PR NI VIRT RES SHR S %CPU %MEM TIME+ COMMAND 110627 root 20 0 12.668g 727016 114860 S 74.0 0.6 64:10.95 /usr/bin/openshift start master --config=/etc/origin/master/master-config.yaml --loglevel=2 57109 root 20 0 2080192 408432 88672 S 59.2 0.3 300:00.89 /usr/bin/openshift start node --config=/etc/origin/node/node-config.yaml --loglevel=2 47765 1000060+ 20 0 1876608 1.721g 25136 S 41.1 1.4 241:12.29 /bin/prometheus -storage.local.retention=720h -storage.local.target-heap-size=2863311530 -storage.local.path=/data -config.file=/etc/prometheus/prometheus.yml -web.external-url=https://prometheus-moni+ 45836 1000050+ 20 0 6939612 465012 18852 S 9.9 0.4 70:48.93 /bin/java -Xms256m -Xmx1g -Djava.awt.headless=true -XX:+UseParNewGC -XX:+UseConcMarkSweepGC -XX:CMSInitiatingOccupancyFraction=75 -XX:+UseCMSInitiatingOccupancyOnly -XX:+HeapDumpOnOutOfMemoryError -XX+Strace output, lots of futex-related calls like this:
Journal of origin-master.service at loglevel 5 does not say much except that it syncs statefulsets every 30s or so:
pprof.rb cpu profile has more than 50% of time spent in
runtime.futex:The full pprof cpu graph is shown here: