Geode Grafana App
perf_test App
The grafana app provides a simple and quick way to integrate Geode with Grafana by including several commands for accessing Grafana along with pre-configured Geode dashboards. For example, you can import the included dashboards into Grafana with the import_grafana command and monitor the entire cluster in a single view.
The Grafana app is part of the padogrid distribution. Run the create_app to install it in your workspace.
create_app -product geode -app grafanaSupport for Prometheus is enabled by default for all Geode clusters created by the create_cluster command. You can enable or disable it by setting the prometheus.enabled property in each cluster's etc/cluster.properties file as follows:
# etc/cluster.properties
# By default, Prometheus is enabled.
prometheus.enabled=trueGrafana is supported via the JMX exporter provided by Prometheus. It is already included in the distribution and fully integrated with Geode out of the box. You can learn more about the exporter from the following site:
URL: https://github.com/prometheus/jmx_exporter
There are three (3) required software components that you must install before you can use the grafana app.
- JQ - JSON Processor
- Prometheus
- Grafana
curl
The PadoGrid grafana app relies on JQ to process JSON objects.
URL: https://stedolan.github.io/jq
Include it in your PATH:
# Assuming jq is placed in your home bin directory:
export PATH=~/bin:$PATHPadoGrid 0.9.22 includes integrated support for Prometheus and Grafana, greatly simplifying the installation and management steps.
Install Prometheus using install_padogrid and update_padogrid:
install_padogrid -product prometheus
update_padogrid -product prometheus
Start Prometheus from the grafana app:
cd_app grafana/bin_sh
./start_prometheusIf you are using PadoGrid 0.9.21 or older, then we recommend upgrading PadoGrid to the latest version and follow the instructions in the previous section.
Download and install Prometheus:
URL: https://prometheus.io/download
To run Prometheus, include its home directory in your PATH and run the prometheus executable as follows:
Unix:
# Using relative path:
cd_app grafana
prometheus --config.file=etc/prometheus.yml

# Using absolute path
prometheus --config.file=$PADOGRID_WORKSPACE/apps/grafana/etc/prometheus.yml
Cygwin:
# Using relative path:
cd_app grafana
prometheus.exe --config.file=$(cygpath -wp etc/prometheus.yml)

# Using absolute path
prometheus --config.file=$(cygpath -wp "$PADOGRID_WORKSPACE/apps/grafana/etc/prometheus.yml")You can monitor Prometheus from your browser:
To view a complete list of metrics:
- All avalable metrics: http://localhost:9090/api/v1/label/name/values
- Metadata: http://localhost:9090/api/v1/metadata
- Prometheus specifics: http://localhost:9090/metrics
- Federated:
curl -G http://localhost:9090/federate -d 'match[]={__name__!=""}'Install Grafana using install_padogird and update_padogrid:
# Install Grafana Enterprise
install_padogrid -product grafana-enterprise
update_padogrid -product grafana-enterprise

# Or install Grafana OSS
install_padogrid -product grafana-oss
update_padogrid -product grafana-oss
Start Grafana from the grafana app:
cd_app grafana/bin_sh
./start_grafanaDownload and install Grafana:
URL: https://grafana.com/grafana/download
Include Grafana in your PATH and run the following (GRAFANA_HOME is the Grafana installation root directory path):
Unix:
export GRAFANA_HOME=<grafana-installation-directory>
export PATH=$PATH:$GRAFANA_HOME/bin
grafana-server -homepath $GRAFANA_HOME
Cygwin:
export GRAFANA_HOME=<grafana-installation-directory>
export PATH=$PATH:$GRAFANA_HOME/bin
grafana-server -homepath $(cygpath -wp "$GRAFANA_HOME")Once Grafana is running, use your web browser to set the user account as follows:
User Name: admin
Password: admin
The grafana app has been preconfigured with the above user name and password. If you have a different account, then you can change them in bin_sh/setenv.sh. Note that the included commands require the user with administration privileges
❗ If you are running this app in the Windows environment then make sure to install curl from Cygwin. Other implementations may not work properly.
The dashboards are organized by Grafana folders and they can be found in the following directory:
cd_app grafana
ls etc/dashboards
The following folders of dashboards are bundled with this distribution.
-
padogrid-perf_test - A set of dashboards for monitoring the entire cluster and map operations executed by the
perf_testapp.
To import the default folder, i.e., padogrid-perf_test, first, make sure Grafana is running, and run the import_folder command as folllows:
cd_app grafana/bin_sh
./import_folder
To import other folders, specify the -folder or -all option.
# To import a folder in 'etc/dashboards'
./import_folder -folder padogrid-perf_test

# To imporal all folders in 'etc/dashboards'
./import_folder -allThe padogrid-perf_test folder includes the perf_test app dashboards. To view data in these dashboards, you must run the perf_test's test_ingestion and test_tx scripts.
For perf_test1 details, see perf_test README.md.
You can also export your dashboards to use them as backup or templates by executing the export_folder command.
# Export all folders found in Grafana. By default, the dashboards are
# exported in the export/ directory. You can change it in setenv.sh.
./export_folder -allYou must convert the exported dashboards to templates by executing the export_to_template command before you can import them back to Grafana. This is due to the Grafana dependency of non-unique local IDs. The generated templates are portable and can be imported into any instance of Grafana using the import_folder command.
# Convert the exported folders to templates. The templates are placed in
# the templates/ directory. See the usage for details.
./export_to_templateThe bin_sh directory contains several other useful commands. You can display the usage of each command by specifying the -? option as shown below.
./create_folder -?
Usage:
   ./create_folder [-folder <folder-name>] [-?]

   Creates the specified Grafana folder.

Default: ./create_folder -folder padogrid-perf_test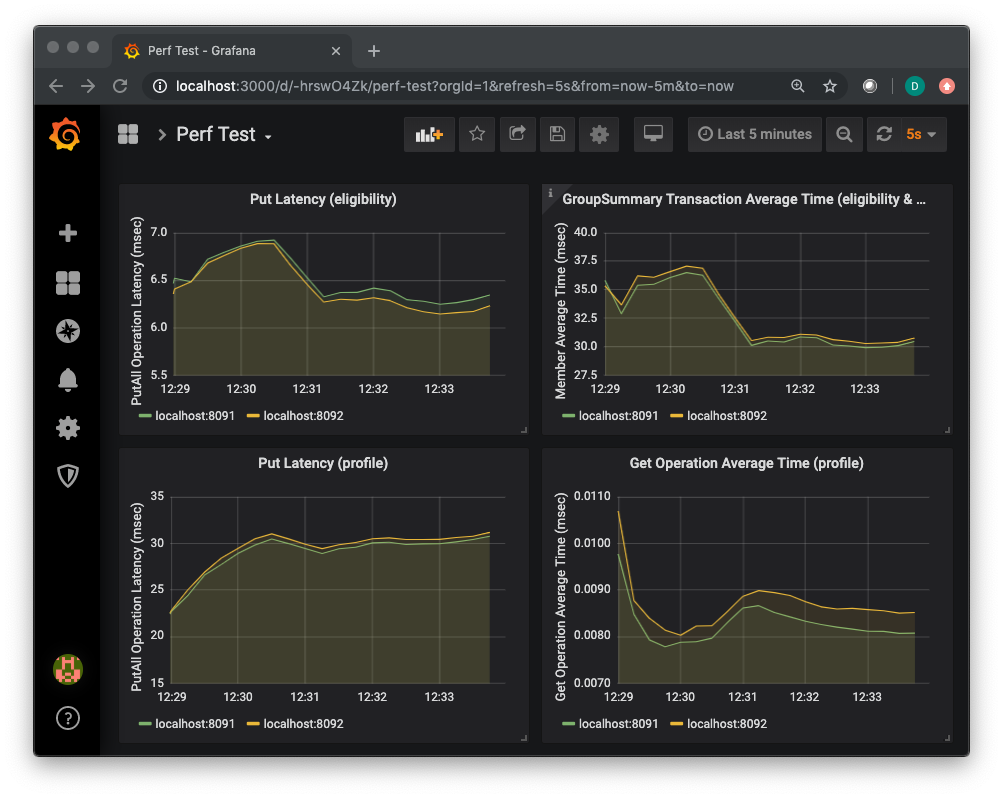
cd_app grafana/bin_sh
./stop_grafana
./stop_prometheusFnd the Prometheus and Grafana process IDs and send the TERM signal.
ps -efwww | grep grafana-server
kill -15 <grafana-pid>

ps -efwww | grep prometheus
kill -15 <prometheus-pid>