(Courtesy: Akash Patel of Kaggle)
The dataset consists of feature vectors belonging to 12,330 sessions. The dataset was formed so that each session would belong to a different user in a 1-year period to avoid any tendency to a specific campaign, special day, user profile, or period.
The dataset consists of 10 numerical and 8 categorical attributes. The 'Revenue' attribute can be used as the class label.
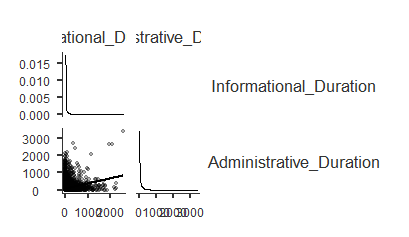
"Administrative", "Administrative Duration", "Informational", "Informational Duration", "Product Related" and "Product Related Duration" represent the number of different types of pages visited by the visitor in that session and total time spent in each of these page categories. The values of these features are derived from the URL information of the pages visited by the user and updated in real time when a user takes an action, e.g. moving from one page to another. The "Bounce Rate", "Exit Rate" and "Page Value" features represent the metrics measured by "Google Analytics" for each page in the e-commerce site. The value of "Bounce Rate" feature for a web page refers to the percentage of visitors who enter the site from that page and then leave ("bounce") without triggering any other requests to the analytics server during that session. The value of "Exit Rate" feature for a specific web page is calculated as for all pageviews to the page, the percentage that were the last in the session. The "Page Value" feature represents the average value for a web page that a user visited before completing an e-commerce transaction. The "Special Day" feature indicates the closeness of the site visiting time to a specific special day (e.g. Mother’s Day, Valentine's Day) in which the sessions are more likely to be finalized with transaction. The value of this attribute is determined by considering the dynamics of e-commerce such as the duration between the order date and delivery date. For example, for Valentina’s day, this value takes a nonzero value between February 2 and February 12, zero before and after this date unless it is close to another special day, and its maximum value of 1 on February 8. The dataset also includes operating system, browser, region, traffic type, visitor type as returning or new visitor, a Boolean value indicating whether the date of the visit is weekend, and month of the year.
Sakar, C.O., Polat, S.O., Katircioglu, M. et al. Neural Comput & Applic (2018).
Inspiration Education is the most powerful weapon which you can use to change the world. 😃
https://github.com/pc1991/Math-Adventures/projects/1#card-67733963
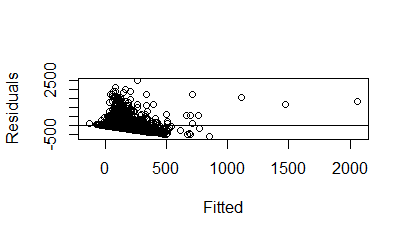
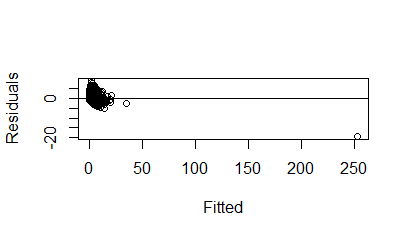
For the original linear model, the majority of the fitted values are not dispersed within the line. A general linear model may be more favorable.
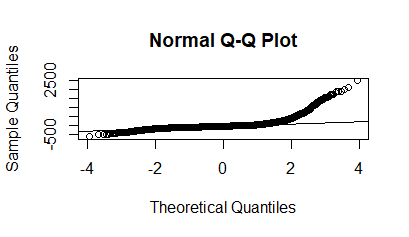
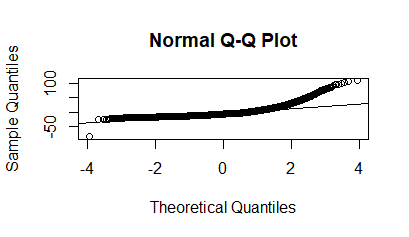
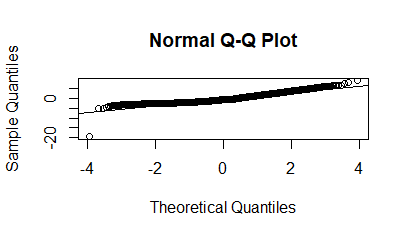
For the quantile-quantile plot with this original model, the fit is mainly accurate throughout.
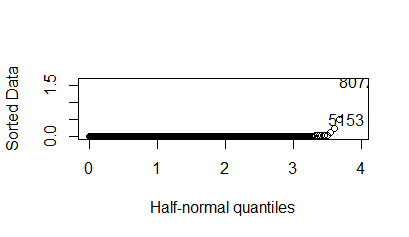
The half-normal probability graph basically proves the importance of how viable this model is.
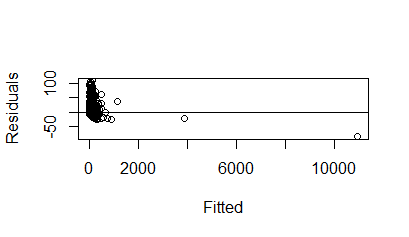
The Box-Cox graph shows that many of the fitted values are not dispersed within the line.
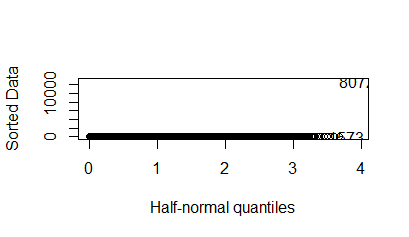
The Half-Normal plot shows how accurate the original online general linear model is.
For this Box-Cox graph, this first general linear model has more accuracy than the original online linear model.
This fit for this first general linear model is accurate throughout.
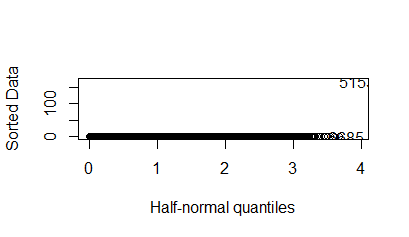
This Half-Normal plot shows how accurate the first original online general linear model is.
This fit for this second general linear model is accurate throughout.
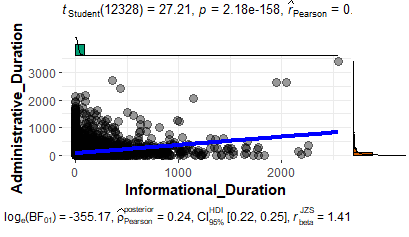
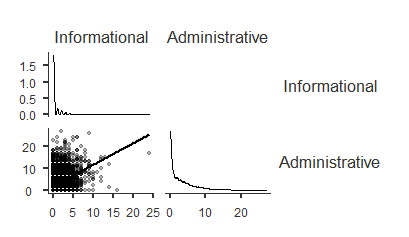
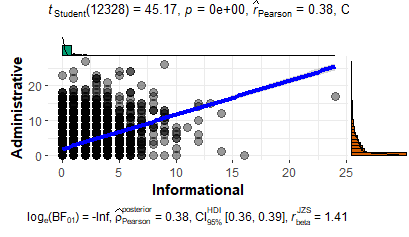
Please take note of the p-values in the next two scatter plots below.
Now..... The Question Is.... Which Model Is The Most Efficient To Rely On To Predict The Future Trends?
We need to find the RMSE of each model.
#Checking the linear and logarithmic root mean square errors of all the linear models#
rmse <- function(x,y) sqrt(mean(x-y)^2)
rmse(g$fitted.values,online$Administrative_Duration)
[1] 2.427661e-14
rmse(g2$fitted.values,online$Administrative_Duration)
[1] 7.759004e-08
rmse(g3$fitted.values,online$Administrative_Duration)
[1] 78.50344
rmse(log(g$fitted.values),log(online$Administrative_Duration))
[1] NaN
Warning message:
In log(g$fitted.values) : NaNs produced
rmse(log(g2$fitted.values),log(online$Administrative_Duration))
[1] Inf
rmse(log(g3$fitted.values),log(online$Administrative_Duration))
[1] Inf
Overall, given the models that are ran, the original linear model is the most efficient with minimal error.
citation(package = 'readr')
Hadley Wickham and Jim Hester (2020). readr: Read Rectangular Text Data. R package version 1.4.0. https://CRAN.R-project.org/package=readr
A BibTeX entry for LaTeX users is
@Manual{, title = {readr: Read Rectangular Text Data}, author = {Hadley Wickham and Jim Hester}, year = {2020}, note = {R package version 1.4.0}, url = {https://CRAN.R-project.org/package=readr}, }
citation(package = 'faraway')
Julian Faraway (2016). faraway: Functions and Datasets for Books by Julian Faraway. R package version 1.0.7. https://CRAN.R-project.org/package=faraway
A BibTeX entry for LaTeX users is
@Manual{, title = {faraway: Functions and Datasets for Books by Julian Faraway}, author = {Julian Faraway}, year = {2016}, note = {R package version 1.0.7}, url = {https://CRAN.R-project.org/package=faraway}, }
ATTENTION: This citation information has been auto-generated from the package DESCRIPTION file and may need manual editing, see ‘help("citation")’.
citation(package = 'MASS')
Venables, W. N. & Ripley, B. D. (2002) Modern Applied Statistics with S. Fourth Edition. Springer, New York. ISBN 0-387-95457-0
A BibTeX entry for LaTeX users is
@Book{, title = {Modern Applied Statistics with S}, author = {W. N. Venables and B. D. Ripley}, publisher = {Springer}, edition = {Fourth}, address = {New York}, year = {2002}, note = {ISBN 0-387-95457-0}, url = {https://www.stats.ox.ac.uk/pub/MASS4/}, }
citation(package = 'jmv')
Ravi Selker, Jonathon Love and Damian Dropmann (2020). jmv: The 'jamovi' Analyses. R package version 1.2.23. https://CRAN.R-project.org/package=jmv
A BibTeX entry for LaTeX users is
@Manual{, title = {jmv: The 'jamovi' Analyses}, author = {Ravi Selker and Jonathon Love and Damian Dropmann}, year = {2020}, note = {R package version 1.2.23}, url = {https://CRAN.R-project.org/package=jmv}, }
ATTENTION: This citation information has been auto-generated from the package DESCRIPTION file and may need manual editing, see ‘help("citation")’.
Copyright (c) 2021 Robert (Christian) Paul & Akash Patel
Permission is hereby granted, free of charge, to any person obtaining a copy of this software and associated documentation files (the "Software"), to deal in the Software without restriction, including without limitation the rights to use, copy, modify, merge, publish, distribute, sublicense, and/or sell copies of the Software, and to permit persons to whom the Software is furnished to do so, subject to the following conditions:
The above copyright notice and this permission notice shall be included in all copies or substantial portions of the Software.
THE SOFTWARE IS PROVIDED "AS IS", WITHOUT WARRANTY OF ANY KIND, EXPRESS OR IMPLIED, INCLUDING BUT NOT LIMITED TO THE WARRANTIES OF MERCHANTABILITY, FITNESS FOR A PARTICULAR PURPOSE AND NONINFRINGEMENT. IN NO EVENT SHALL THE AUTHORS OR COPYRIGHT HOLDERS BE LIABLE FOR ANY CLAIM, DAMAGES OR OTHER LIABILITY, WHETHER IN AN ACTION OF CONTRACT, TORT OR OTHERWISE, ARISING FROM, OUT OF OR IN CONNECTION WITH THE SOFTWARE OR THE USE OR OTHER DEALINGS IN THE SOFTWARE.