A single-file, in-browser music visualizer with a hacker / eclipse aesthetic. No install — you just open one file in your web browser. Everything runs 100% locally; nothing is uploaded.
No coding. No installing. It's just one file you open in your web browser.
- Scroll down to the file list, click
index.html. - On that page, click the download icon (⬇, near the top-right — it may say "Download raw file").
- Save it somewhere easy to find, like your Desktop.
Prefer one download? Click the green
<> Codebutton at the top of the repo → Download ZIP → unzip it → the file is inside.
- Double-click
index.html. It opens in your web browser. That's the whole app. Done. - (If it opens in a code editor instead, right-click it → Open with → Chrome or Edge.)
- Drag a music file (an
.mp3) from your computer onto the window. It starts playing and reacting immediately. - Or click the ▶ Load Songs button and pick your files.
- Move your mouse to show the controls at the bottom (they hide while it plays).
- Use the dropdown menu to pick a different visual.
- Click the colored dots to change colors; drag the sliders to change the feel.
- Click the picture itself to pause/play.
- Start playing music in YouTube Music / Spotify in another browser tab.
- In the visualizer, click the 🎙️ microphone button.
- A pop-up appears — pick the tab that's playing music, and ✅ check the box that says "Share tab audio," then click Share.
- The visuals now react to whatever's playing in that tab.
⚠️ If the visuals look flat/dead while doing this, you forgot to check "Share tab audio." This part works best in Chrome or Edge.
- Click the ⏺ record button to start, then click it again to stop. It saves a video file you can upload to YouTube.
| Button | What it does |
|---|---|
| ▶ / ⏸ | Play / pause (or just click the picture) |
| 🎲 | Auto mode — randomly cycles visuals for you |
| 🎙️ | Capture audio from another tab (YouTube Music, etc.) |
| 🔬 | Analyze the song's BPM & musical key |
| ⏺ | Record a video |
| ☰ | Open the playlist / queue |
| 🎬 | Add a background video or image |
| ⛶ | Fullscreen |
- Nothing on screen? Load a song first, and make sure it's playing (click the picture).
- No sound or no reaction? Check your volume, and that the right song/tab is selected.
- Use Chrome or Edge. Some features (like tab-audio capture) don't work in other browsers.
- Everything runs on your own computer — no internet upload, nothing leaves your machine.
(click for the full demo video)
| Triangular Peaks | Eclipse Core |
|---|---|
 |
 |
| Aurora Flow | Code Rain |
|---|---|
 |
 |
| Radial Spectrum | Particle Burst |
|---|---|
 |
 |
A single-file, no-build, in-browser music visualizer. Drop in a track (or capture a live stream), pick a visual, and it reacts to the real audio in real time — neon spectra, a 3D triangular-peaks terrain, code rain, aurora curtains, and an Unreal-Engine-style debug HUD with live BPM, key, and a beat timeline. One index.html, no dependencies, no server.
- Real audio reactivity — Web Audio
AnalyserNodeFFT drives every visual off the actual frequency/waveform data. - 9 visualization modes (see below), each with neon glow, trails, and the Penumbra palette.
- Penumbra HUD overlay — corona-bracket frame, header strip, a
void MEDIA::Playing("track")now-playing readout with progress bar, live BASS/LVL meters, BPM, musical key, and a scrolling beat timeline. - Offline track analysis — decodes the file and computes BPM (onset-envelope autocorrelation) and musical key (full-track chroma + Krumhansl-Schmuckler), cached in
localStorageso each song is analyzed once. - Live audio capture — visualize streamed audio (YouTube Music, Spotify web, anything) by capturing tab/system audio.
- Playlist / queue — load many tracks, drag-and-drop, auto-advance, prev/next.
- Video recording — capture the canvas + audio to a downloadable
.webm. - Auto / random mode — shuffles visuals + settings on a timer, hands-free.
- Backgrounds — optionally composite visuals over a looping video or image (non-Penumbra modes).
- Live controls — reactivity, trails, color-shift speed, visualizer height, brightness, volume, 5 color themes.
Penumbra
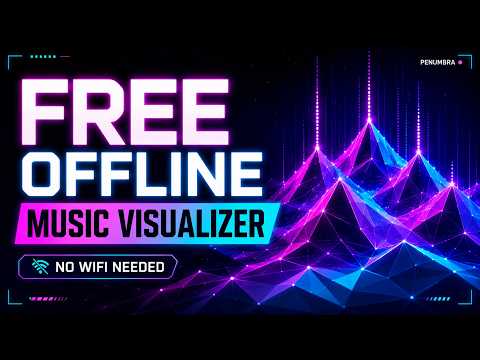
- Triangular Peaks — a wide 3D perspective lattice of equilateral triangles (hex tiles) where the spectrum radiates from the center into a mountain of peaks, with vertical laser streaks and flowing color.
- Eclipse Core — the signature pulsing corona ring with the spectrum as corona spikes.
- Code Rain — Matrix-style falling C++/hex glyphs whose fall speed tracks the music.
Spectrum
- Radial Spectrum · Waveform · Mirror Bars · Pulse Rings · Tunnel Grid · Particle Burst · Aurora Flow
Space play/pause · F fullscreen · H toggle HUD · ←/→ seek ±5s
- Pure HTML/CSS/JS in a single file — no build step, no frameworks, no dependencies.
- Web Audio API (
AnalyserNode,MediaElementSource,MediaStreamSource,MediaStreamDestination) for analysis, capture, and recording. - Canvas 2D with an offscreen FX layer composited via
lighten/screenblends for the glow. - A small in-file FFT powers the offline BPM/key analyzer.
- JetBrains Mono + the Penumbra palette (corona teal, void purple-black, vaporwave-Rider syntax colors).
See repository license. Part of the Penumbra stream toolkit.