open Plotly.NET
open Newtonsoft.Json

let geoJson =
    Http.RequestString "https://raw.githubusercontent.com/plotly/datasets/master/geojson-counties-fips.json"
    |> JsonConvert.DeserializeObject

type csvProvider = CsvProvider<"https://raw.githubusercontent.com/plotly/datasets/master/fips-unemp-16.csv">

let fips_data = csvProvider.Load("https://raw.githubusercontent.com/plotly/datasets/master/fips-unemp-16.csv")

let z = fips_data.Rows |> Seq.map (fun row -> float row.Unemp)
let locations = fips_data.Rows |> Seq.map (fun row -> row.Fips)

Chart.ChoroplethMapbox(z=z,geoJson=geoJson,locations=locations,FeatureIdKey="id",Colorscale=StyleParam.Colorscale.Viridis,ZMin=0.,ZMax=12.)
|> Chart.withMapbox(
        Mapbox.init(Style=StyleParam.MapboxStyle.CartoPositron,Zoom=3.,Center=(-95.7129,37.0902))
    )
|> Chart.withSize(width=1100.,height=700.)
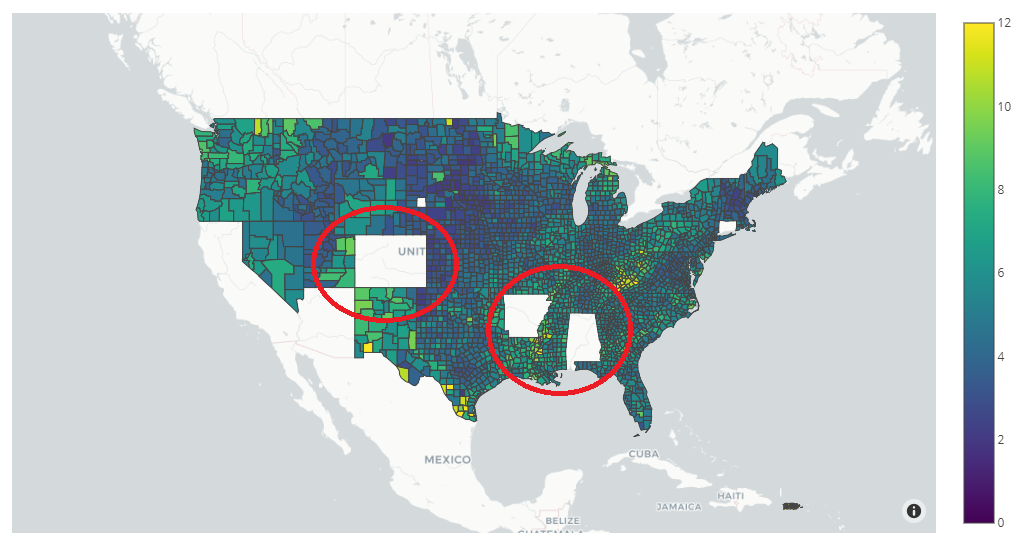
Expected Plot:
Current Plot: