Multi-axis chart using with*_Axis rather than with*_AxisStyle #77
Description
Description
The documentation provides an example of a multi-axis chart using withY_AxisStyle. However, I need more control over the axes, so want to use Axis.LinearAxis.init and withY_Axis, but when I do the chart does not appear as expected.
Repro steps
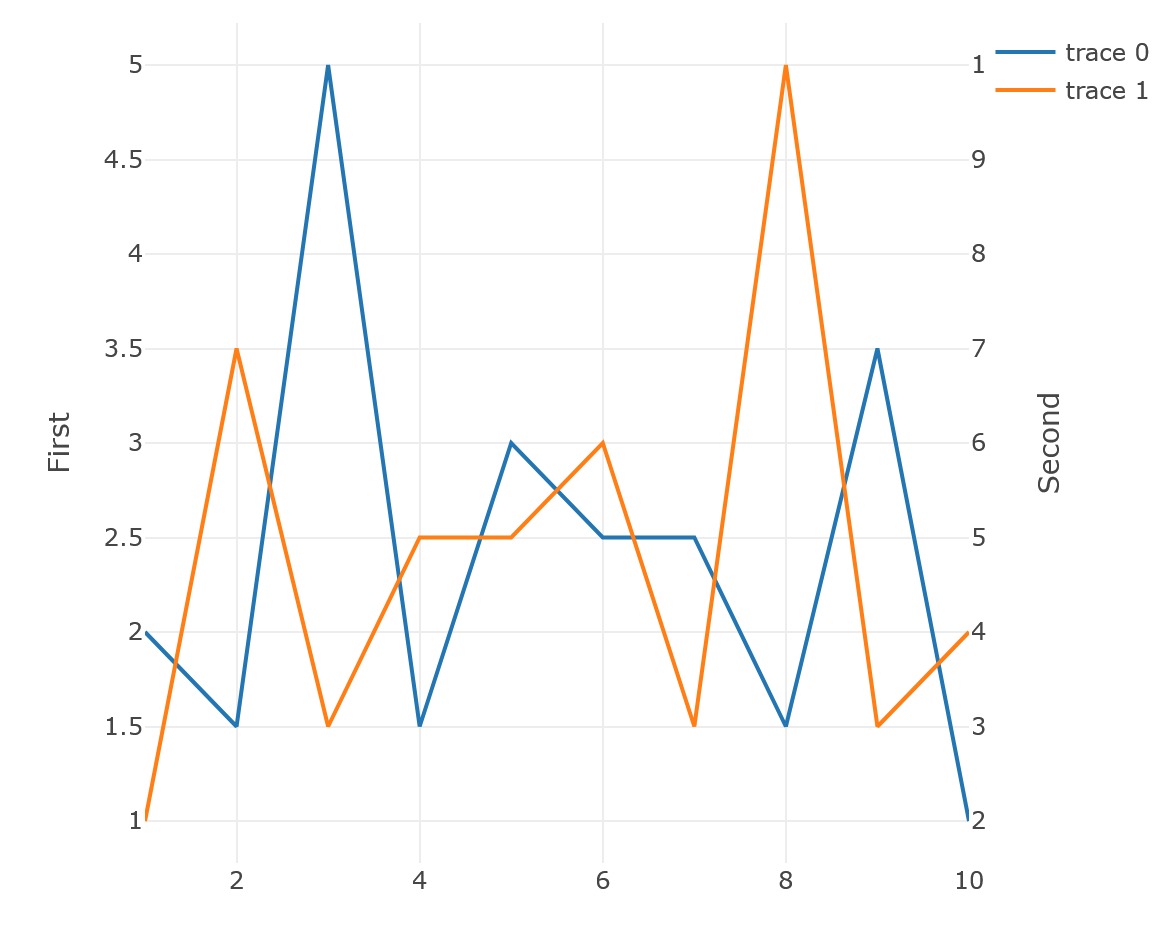
let x = [1.; 2.; 3.; 4.; 5.; 6.; 7.; 8.; 9.; 10.; ]
let y = [2.; 1.5; 5.; 1.5; 3.; 2.5; 2.5; 1.5; 3.5; 1.]
let y' = y |> List.map (fun y -> y * 2.) |> List.rev

let firstAxis =
    Axis.LinearAxis.init(
        Anchor = StyleParam.AxisAnchorId.Y 1,
        Title ="First"
    )
let secondAxis =
    Axis.LinearAxis.init(
        Anchor = StyleParam.AxisAnchorId.Y 2,
        Title ="Second",
        Overlaying = StyleParam.AxisAnchorId.Y 1,
        Side = StyleParam.Side.Right
    )
let firstChart =
    Chart.Line(x, y)
    |> Chart.withAxisAnchor(Y = 1)
let secondChart =
    Chart.Line(x, y')
    |> Chart.withAxisAnchor(Y = 2)

[
    firstChart
    secondChart
]
|> Chart.Combine
|> Chart.withY_Axis firstAxis
|> Chart.withY_Axis secondAxis
|> Chart.Show
Expected behavior
(I created this image by using withY_AxisStyle - basically just the code from the example in the docs)
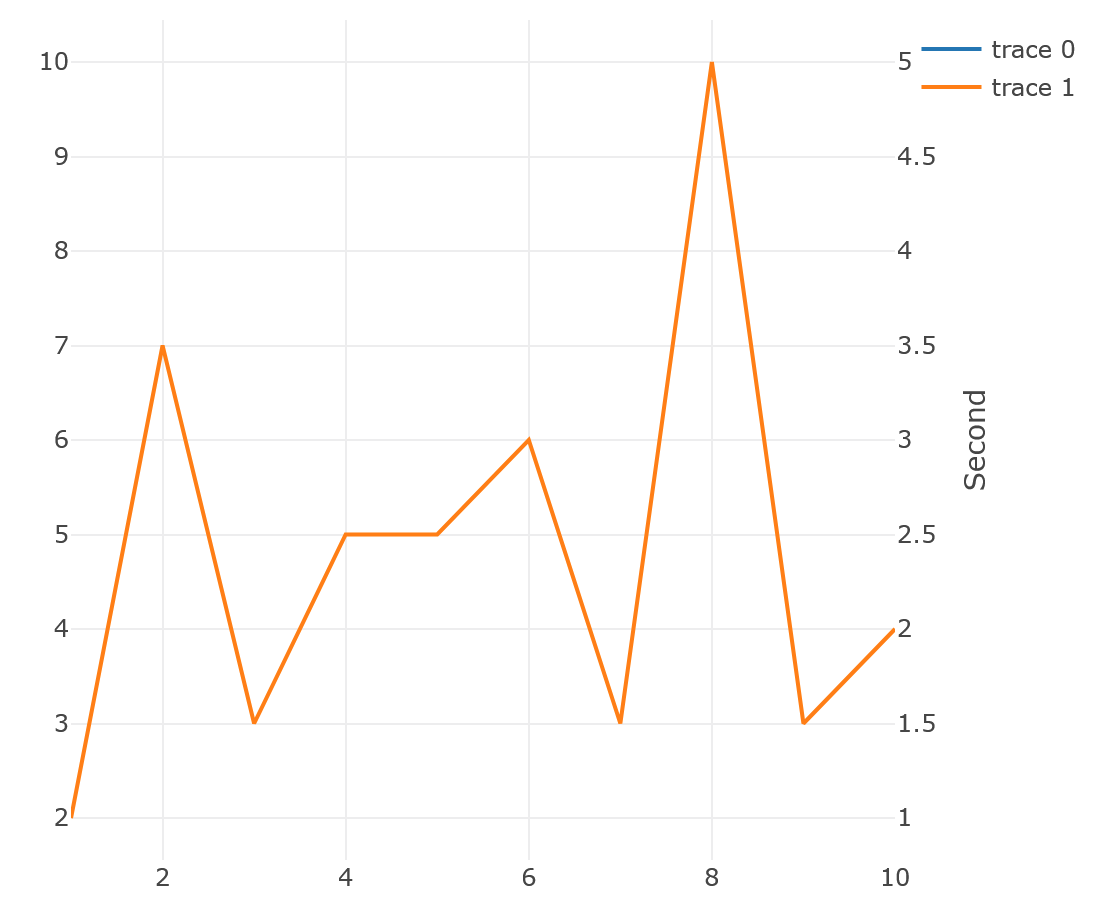
Actual behavior
Known workarounds
None known.
Related information
- Operating system: Windows 10
- Branch: I'm using
2.0.0-beta9 - .NET Runtime: .NET 5.0