Plotly doesn't render geom_dotplot correctly #1073
Description
ggplot2:
ggplot(mtcars, aes(hp)) + geom_dotplot(binwidth = 10, stackdir = 'center')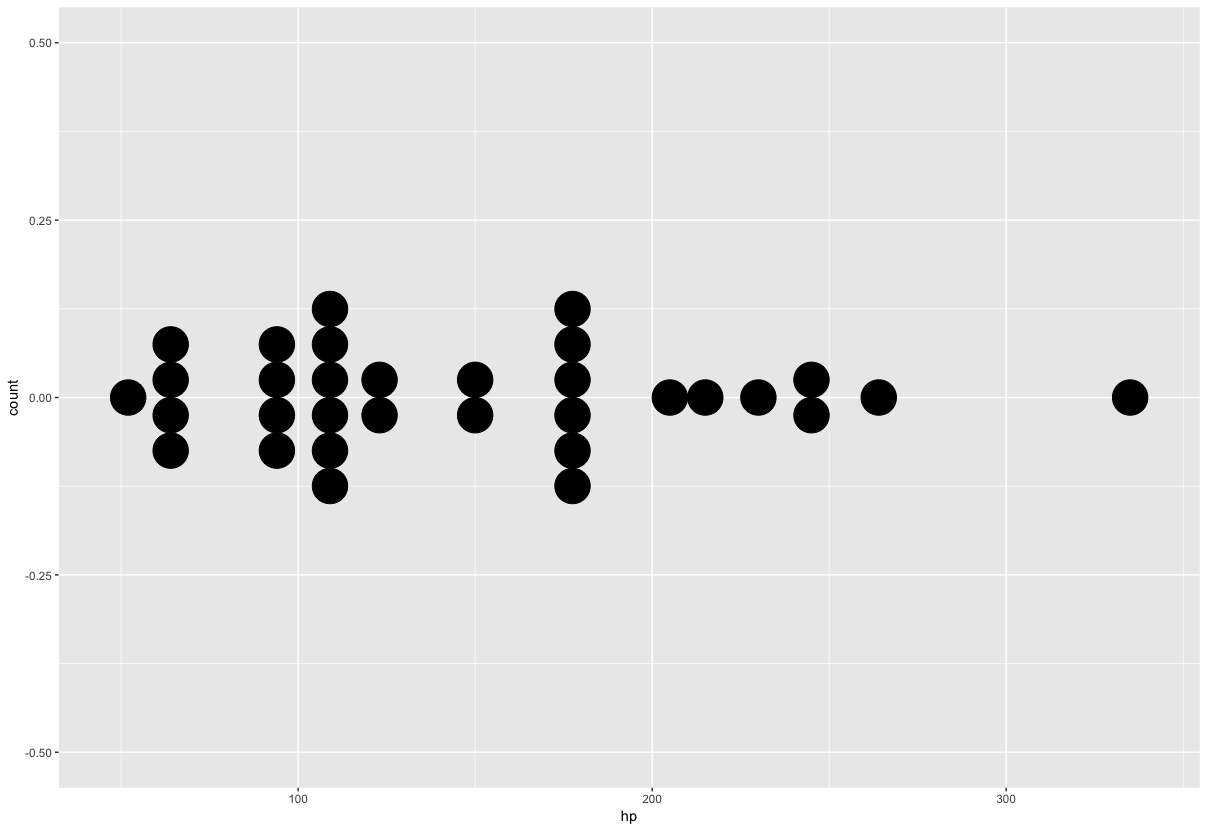
plotly:
ggplotly(ggplot(mtcars, aes(hp)) + geom_dotplot(binwidth = 10, stackdir = 'center'))
ggplot2:
ggplot(mtcars, aes(hp)) + geom_dotplot(binwidth = 10, stackdir = 'center')
plotly:
ggplotly(ggplot(mtcars, aes(hp)) + geom_dotplot(binwidth = 10, stackdir = 'center'))