Colour legend title cannot be changed #1411
Description
Related to #1410
The following code creates a scatterplot and tries to change the title of the colour legend
library(plotly)
df <- data.frame(x = 1:5, y = 1:5, colvariable = c(1,2,1,2,1))
plot_ly(df, x = ~x, y = ~y, color = ~colvariable ) %>%
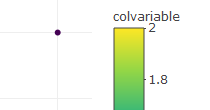
add_markers(marker = list(colorbar = list(title = "test")))
Rather than using "test" as the legend title, it says "colvariable".
If all the colour values are identical (such as in #1410) then both "colvariable" and "test" are written and overlapping one another:
df <- data.frame(x = 1:5, y = 1:5, colvariable = c(1,1,1,1,1))
plot_ly(df, x = ~x, y = ~y, color = ~colvariable ) %>%
    add_markers(marker = list(colorbar = list(title = "test")))