plotly.js aggregations by N columns #2123
Description
Here for example I've already grouped air pollution measurements by state name, now I would like to get an average over all counties by year:
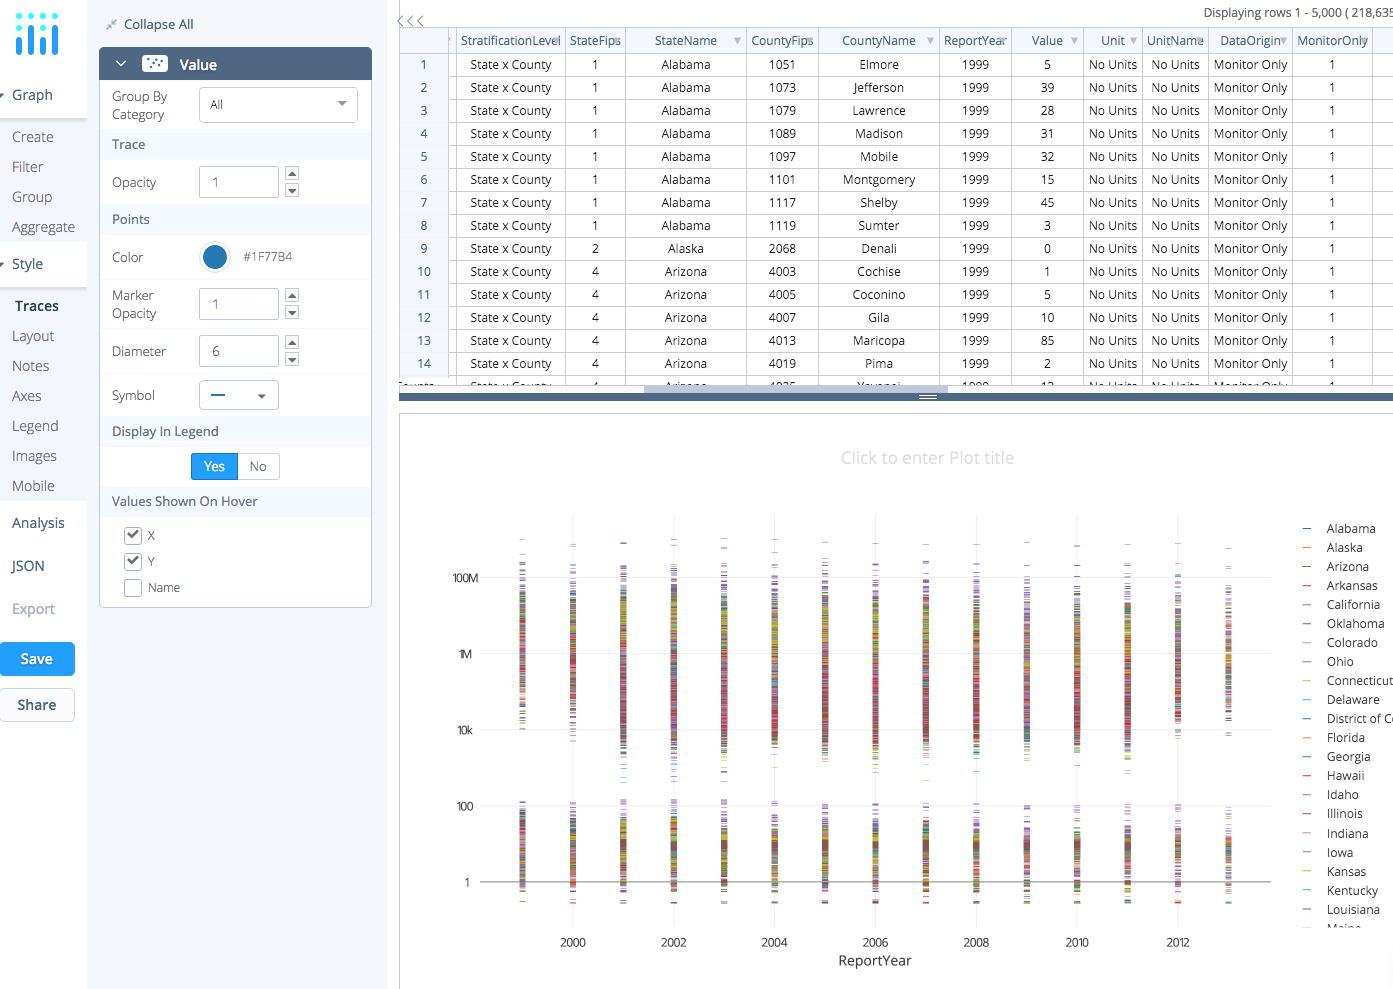

Here for example I've already grouped air pollution measurements by state name, now I would like to get an average over all counties by year: