Filled area plots ignore NaNs #5722
Description
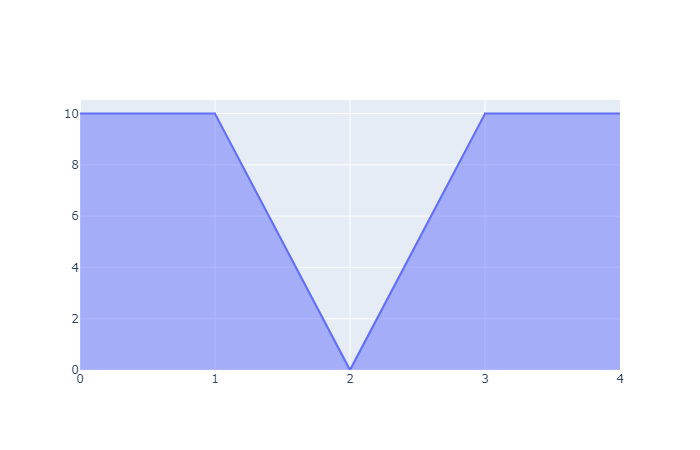
Filled area plots do not show gaps for NaNs.
Example 1
import plotly.graph_objects as go
fig = go.Figure()
fig.add_scatter( x=[0,1,2,3,4], y=[10,10,None,10,10],
    fill='tozeroy',
)
fig.show()
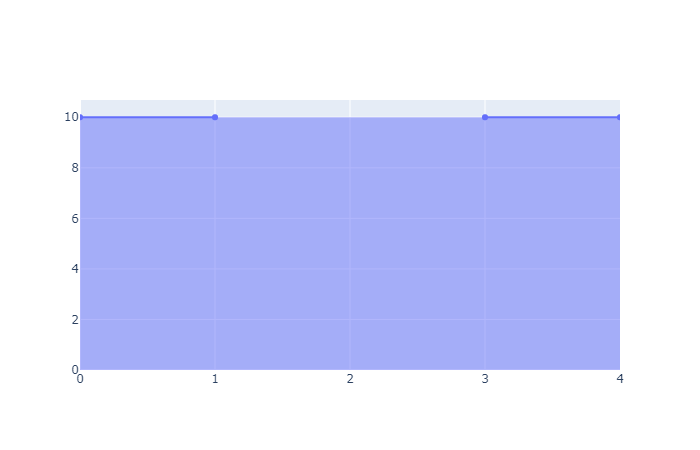
Example 2
import plotly.graph_objects as go
fig = go.Figure()
fig.add_scatter( x=[0,1,2,3,4], y=[10,10,None,10,10],
    stackgroup='one',
)
fig.show()