Sometimes scatter graph is showing out of the range #5890
Description
Hello Plotly,
My issue is when first time the scatter graph is rendering out of the range even though ranges are correct, but when I refresh the browser it's working fine. Please check the below images and my configuration of Plotly.
Out of the Range Images:
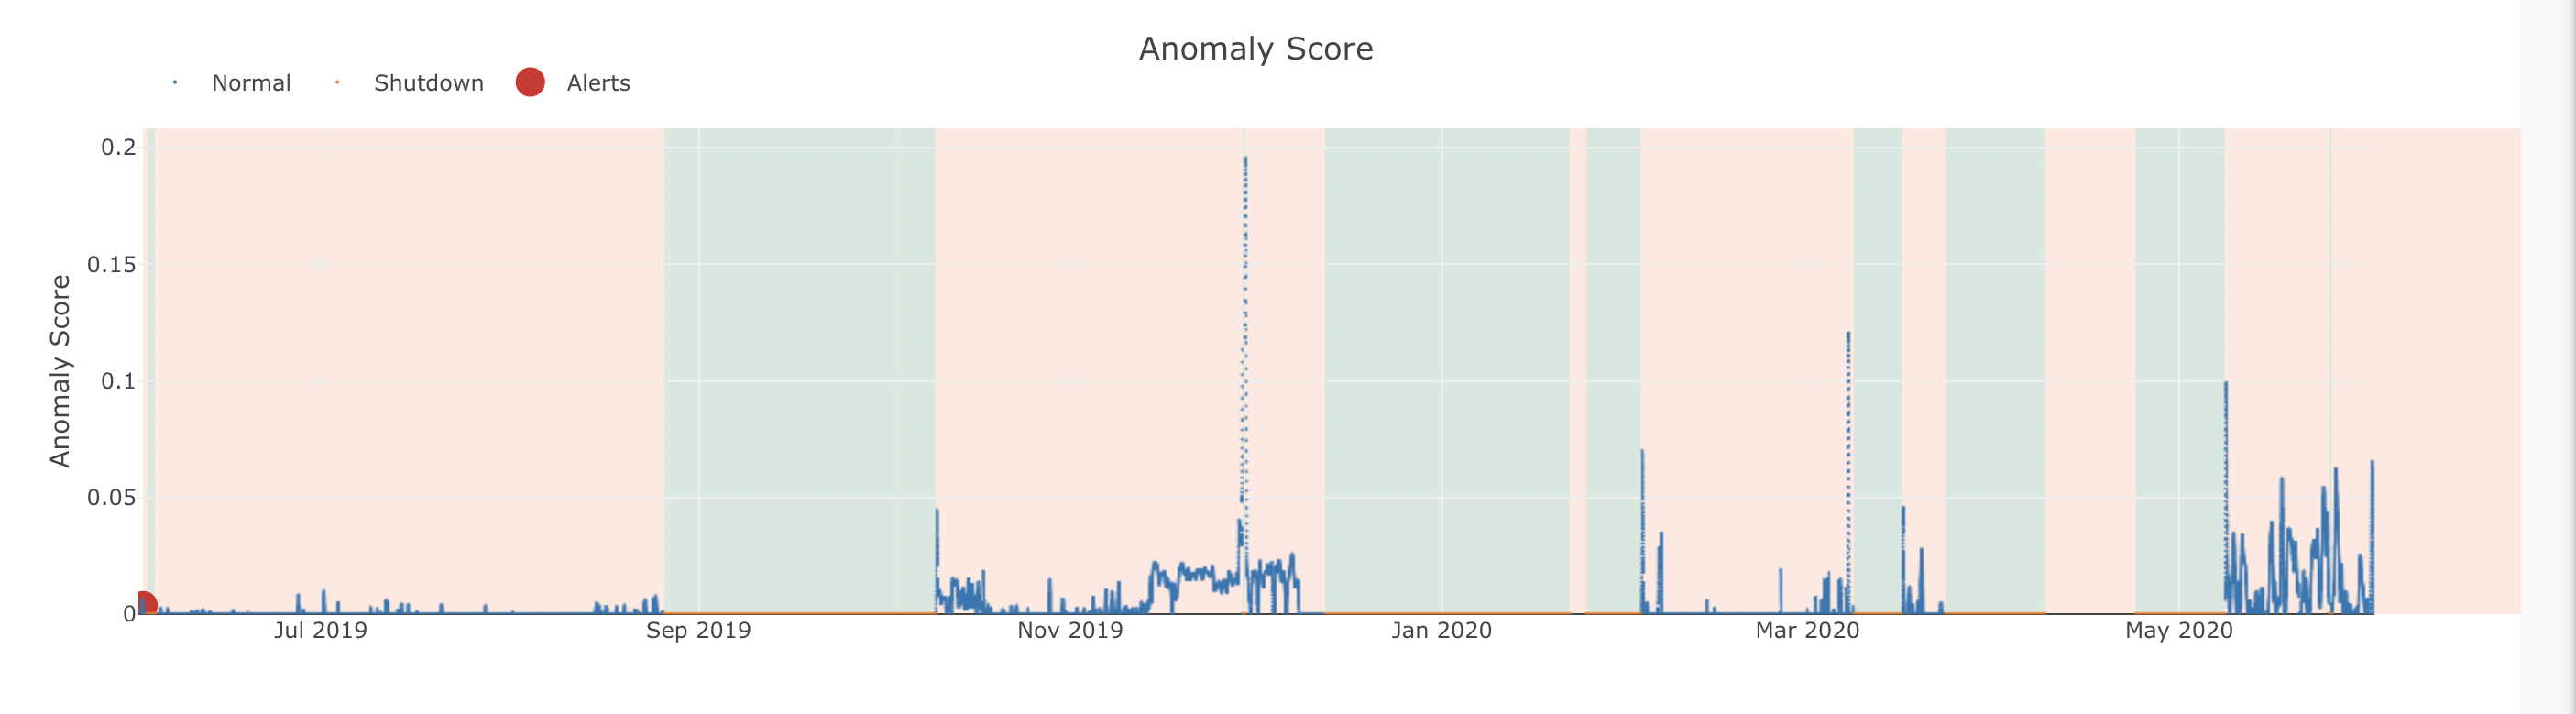
Here: the right side x-axis is out of the range.
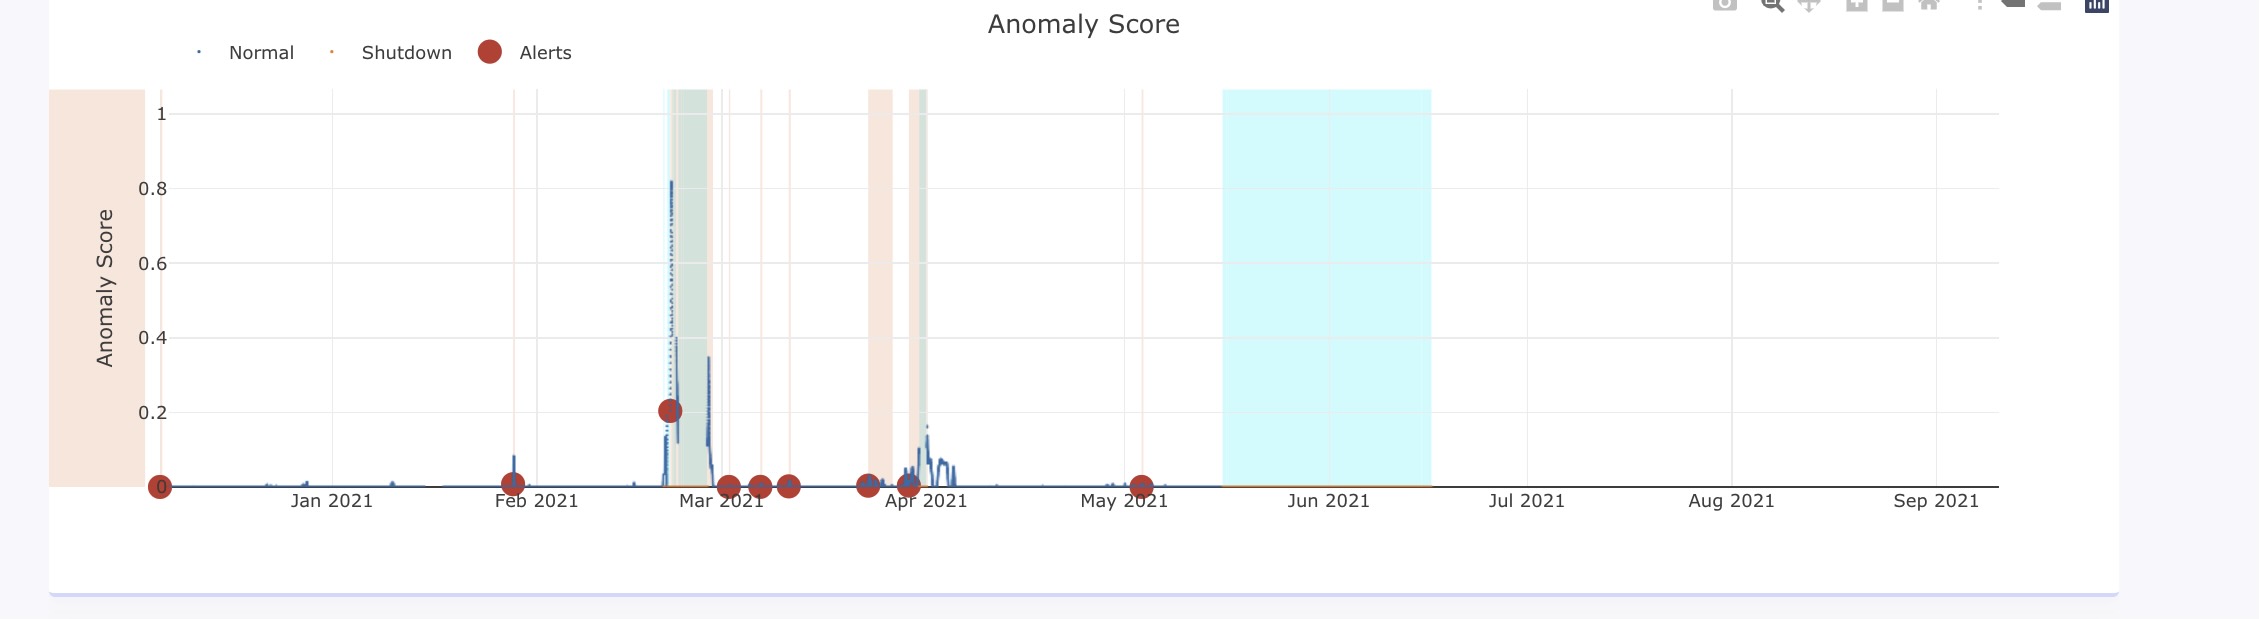
Here: sometimes the left x-axis is out of the range.
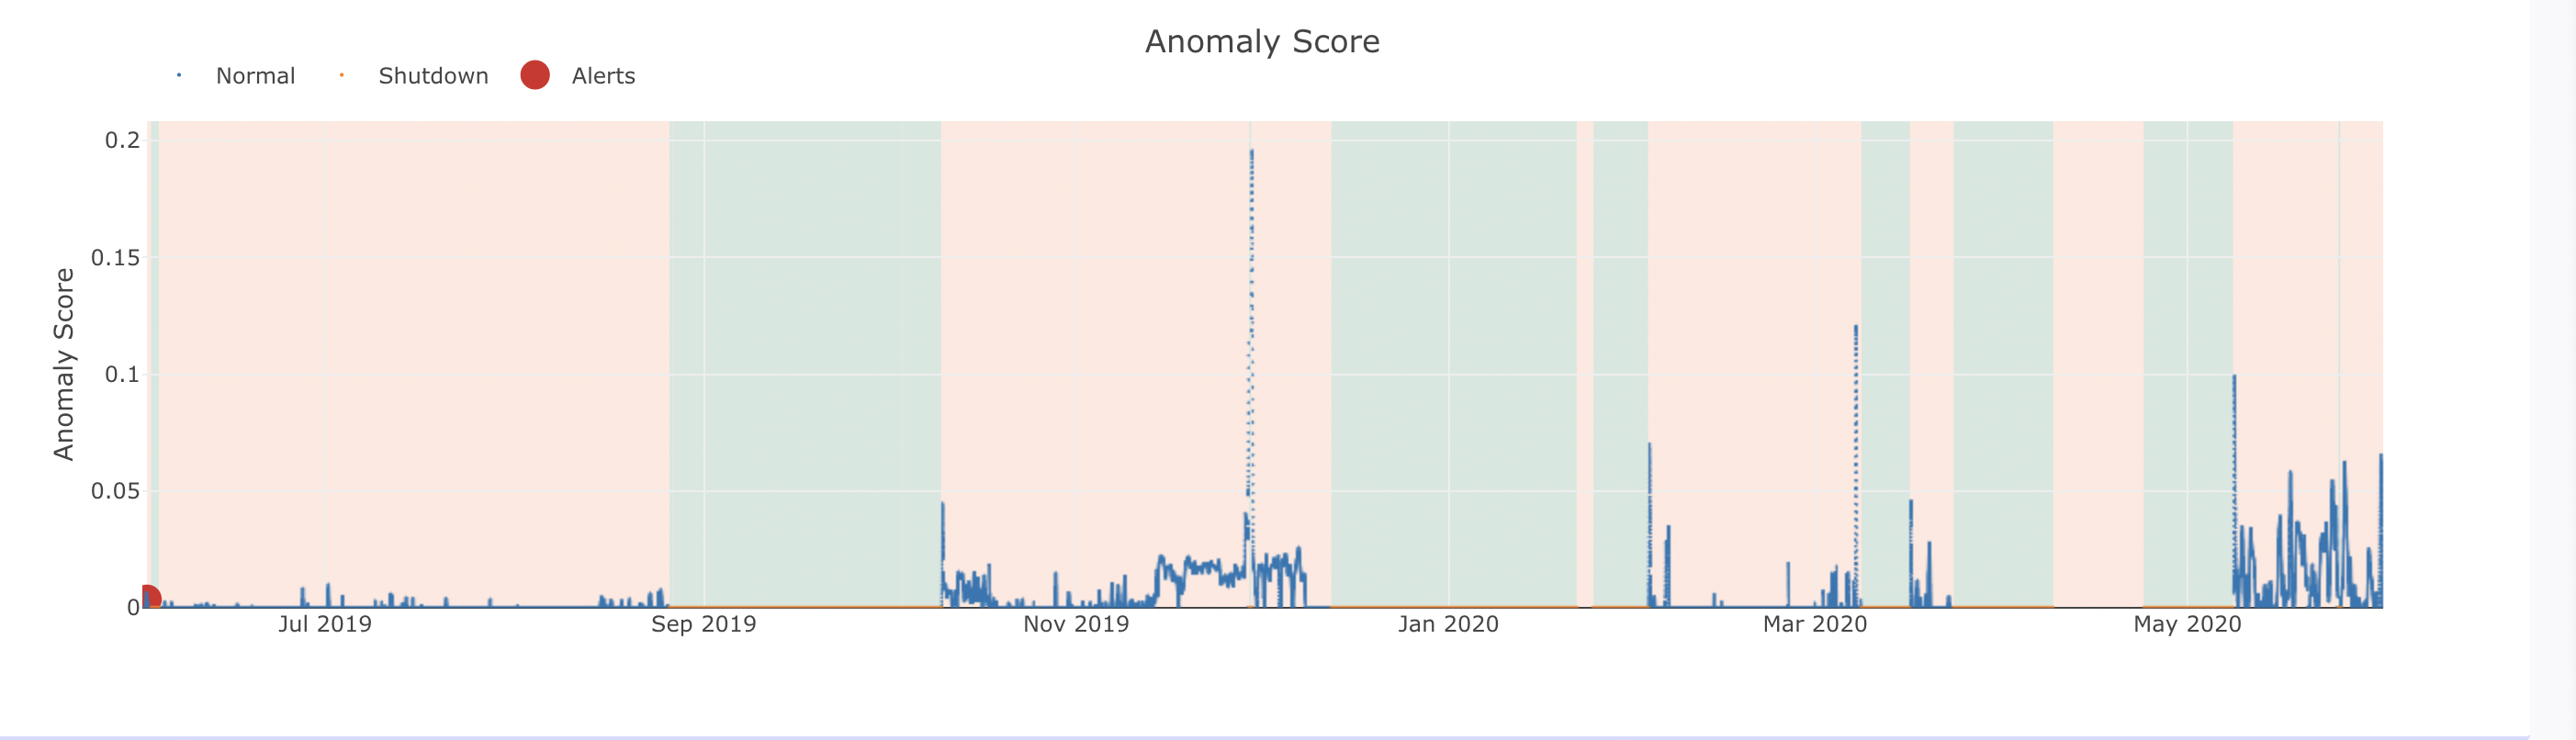
When I refresh the browser, it's working perfectly fine.
My configuration of Plotly is:
  systemAnomalyScore: any = {
    data: [{
      name: 'Normal',
      x: [],
      y: [],
      mode: 'markers',
      marker: {
        size: 2
      },
      type: 'scattergl',
    },
    {
      name: 'Shutdown',
      x: [],
      y: [],
      hovertext: [],
      hoverinfo: 'text',
      mode: 'markers',
      marker: {
        size: 2
      },
      type: 'scattergl',
    },
    {
      name: 'Maintenance',
      x: [],
      y: [],
      hovertext: [],
      hoverinfo: 'text',
      mode: 'markers',
      marker: {
        size: 16
      },
      type: 'scatter',
    },
    {
      name: 'Alerts',
      x: [],
      y: [],
      mode: 'markers',
      marker: {
        size: 16
      },
      type: 'scatter',
    }
    ],
    layout: {
      title: 'Anomaly Score',
      hovermode: 'closest',
      showlegend: true,
      legend: { "orientation": "h", x: 0, y: 1.15 },
      annotations: [],
      datarevision: 0,
      height: 400,
      margin: {
        t: 75,
        b: 60
      },
      autosize: true,
      xaxis: {
        ticks: false,
        autorange: false,
      },
      yaxis: {
        title: 'Anomaly Score',
        rangemode: 'nonnegative'
      },
      shapes: []
    }
  };
Please let me know if I'm doing anything wrong with my configuration or some other thing.