Ohlc hoverinfo shows multiple xaxis dates #1003
Description
Using the latest libraries with plotly 2.5.1
(dash) cartier@cartier-VirtualBox:~/Documents/dash$ pip list
dash (0.21.1)
dash-core-components (0.22.1)
dash-html-components (0.10.1)
dash-renderer (0.12.1)
...
plotly (2.5.1)
I built upon the very first example here & returned a basic ohlc chart instead of a scatter plot
trace = go.Ohlc(x=df.index,
                   open=df.open,
                   high=df.high,
                   low=df.low,
                   close=df.close,
                   showlegend = False)

layout = go.Layout(
xaxis = dict(
    rangeslider = dict(
        visible = False
    )
)
)

return {
    'data': [trace_close,trace], 'layout':layout
}
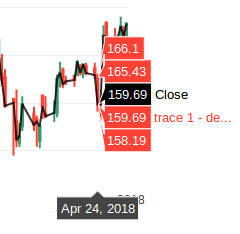
When I check the graph it seems I'm getting 2 dates for each hover point
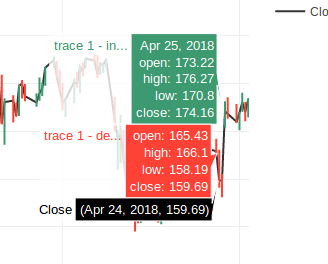
I have no idea how/why it's selecting 2 different dates? I decided to try a different chart
trace = go.Candlestick
and when I do so I get a single date as expected but no labels on the candlestick values...