Odd behavior of subplot figure when resetting axes or selecting / deselecting in legend #1766
Description
Hi,
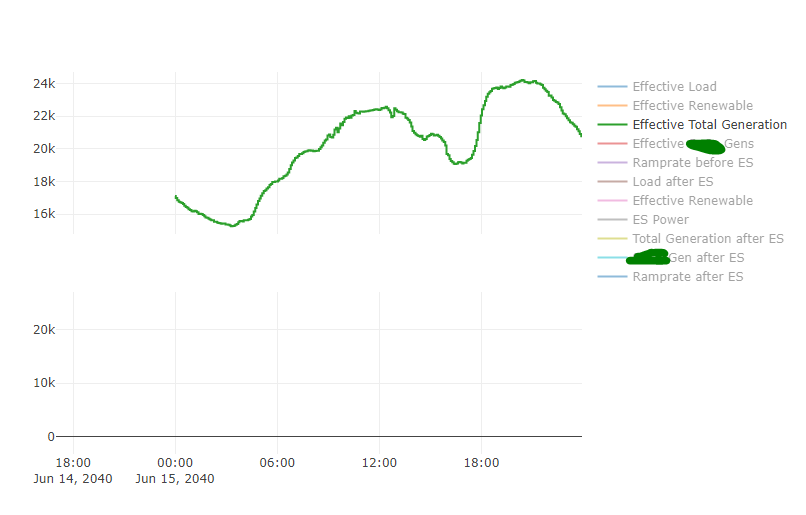
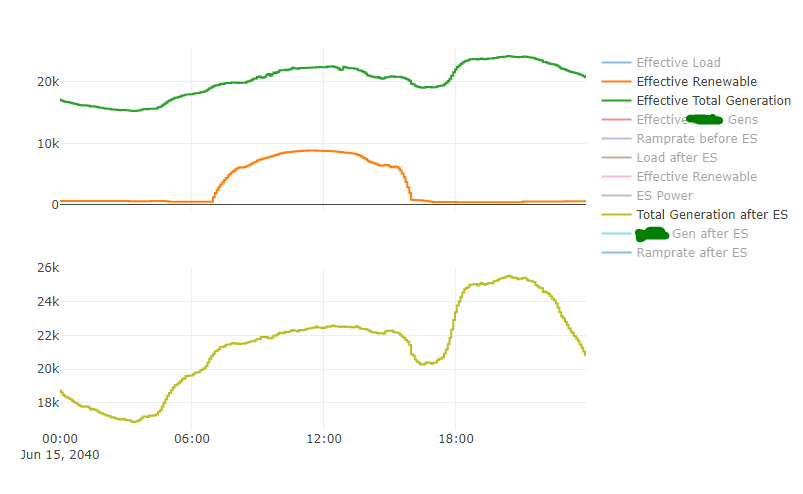
I've not experienced this before with subplots, but I'm noticing it now with the following figure which contains 2 subplots:

This is the code to get there:
`from plotly_future import v4_subplots
from plotly.subplots import make_subplots
import plotly.graph_objs as go
from plotly.offline import plot'
fig = make_subplots(rows=2, cols=1, shared_xaxes=True)
before = ['Effective Load', 'Effective Renewable', 'Effective Total Generation', 'Effective SoCo Gens', 'Ramprate before ES']
after = ['Load after ES', 'Effective Renewable', 'ES Power', 'Total Generation after ES', 'SoCo Gen after ES', 'Ramprate after ES']

for col in before:
    fig.add_trace(go.Scatter(
                                x=grid_data_with_hood.index,
                                y=grid_data_with_hood[col],
                                name=col,
                                line=dict(shape='vh')
                            ),
                    row=1, col=1)

for col in after:
    fig.add_trace(go.Scatter(
        x=grid_data_with_hood.index,
        y=grid_data_with_hood[col],
        name=col,
        line=dict(shape='vh')
    ),
        row=2, col=1)

plot(fig, filename = 'before_and_after_ES.html')`
If I isolate a scatter in one of the plots by double clicking it in the legend, the left limit of the x-axis seems to expand zooming the graph out a little:
If i add another trace to the same subplot, it happens again:

this will continue to happen as more plots are added or hidden from this subplot. If I choose to unhide a scatter from the OTHER subplot, it reset's the axis:
If i try to reset the axes manually by double clicking the plot or pressing the "reset axes" toolbar button, it does it again!

As far as I can tell it happens on Chrome, Firefox, and IE and also persists after downgrading from 4.1.1 to 3.10 to 3.9 to 3.8.1
Let me know if any other info would be useful, thanks for the help!