You signed in with another tab or window. Reload to refresh your session.You signed out in another tab or window. Reload to refresh your session.You switched accounts on another tab or window. Reload to refresh your session.Dismiss alert
I'm currently using timeline plots to display boxplots along a timeline (the use case is a "probabilistic" gantt chart):
I would like to switch to violin plots but it does not seem to be possible at the moment.

I'm currently using timeline plots to display boxplots along a timeline (the use case is a "probabilistic" gantt chart):
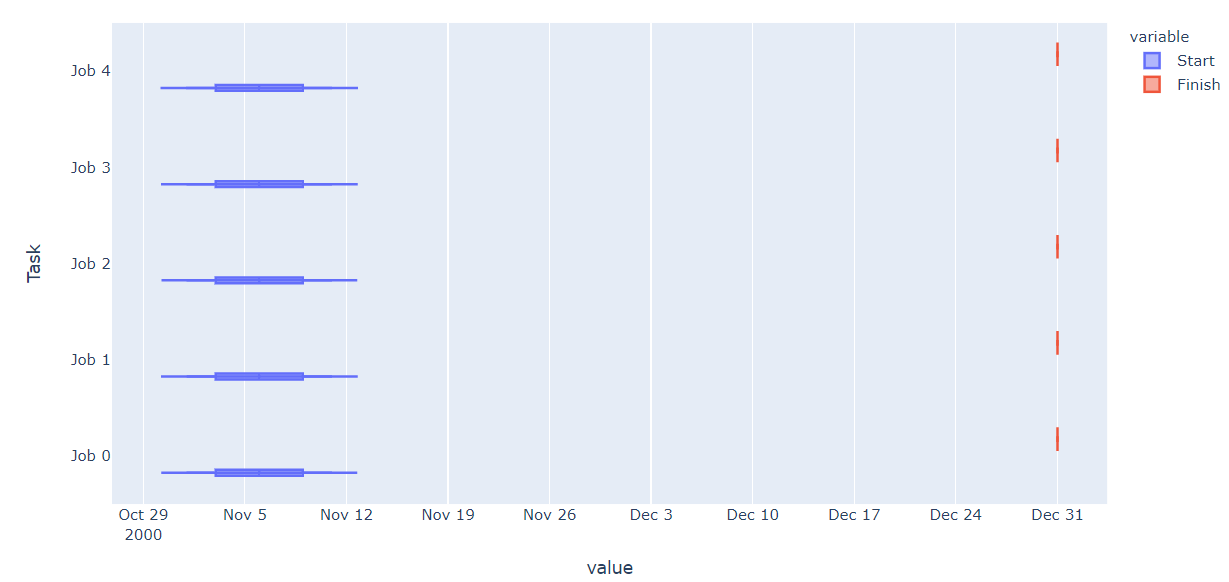
I would like to switch to violin plots but it does not seem to be possible at the moment.