px.choropleth inverts polygon fill #3979
Description
I was trying to show some regions with px.choropleth(), but most of the regions were colored inverted, i.e. the outside of the polygons were filled (the regions can be found here).
Here is a minimal example:
import geopandas as gpd
import plotly.express as px
import io

gdf = gpd.read_file(io.StringIO("""
{
    "type": "FeatureCollection",
    "name": "polies",
    "features": [{
            "type": "Feature",
            "properties": {
                "name": "poly1"
            },
            "geometry": {
                "type": "Polygon",
                "coordinates": [[
                        [13.9329914, 45.9451589],
                        [13.821011, 45.8507284],
                        [14.1229608, 45.8653449],
                        [13.9761061, 45.928769],
                        [13.9329914, 45.9451589]
                ]]}}]}
"""))
fig = px.choropleth(gdf, geojson=gdf, color="name", locations="name", featureidkey="properties.name")
fig.update_geos(fitbounds="locations", visible=False)
fig.update_layout(margin={"r": 0, "t": 0, "l": 0, "b": 0})
fig.show()
The result is

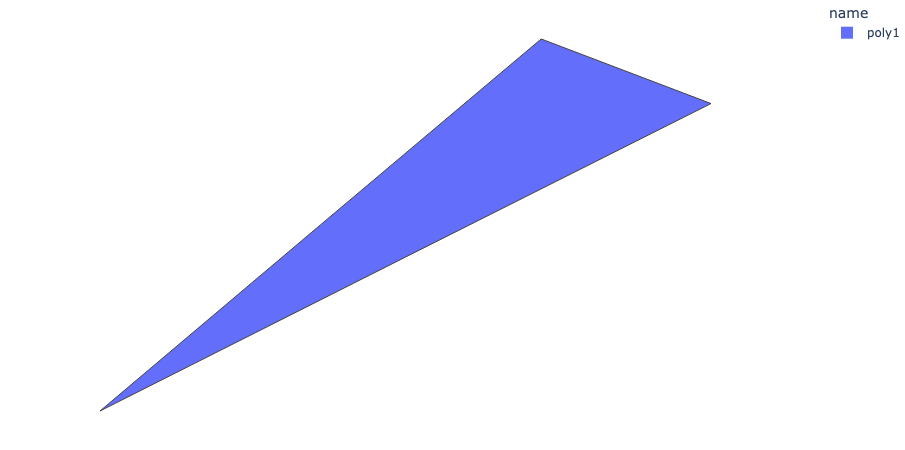
If I remove the middle (3rd) point (everything else is the same), the result is correct:
import geopandas as gpd
import plotly.express as px
import io

gdf = gpd.read_file(io.StringIO("""
{
    "type": "FeatureCollection",
    "name": "polies",
    "features": [{
            "type": "Feature",
            "properties": {
                "name": "poly1"
            },
            "geometry": {
                "type": "Polygon",
                "coordinates": [[
                        [13.9329914, 45.9451589],
                        [13.821011, 45.8507284],
                        [13.9761061, 45.928769],
                        [13.9329914, 45.9451589]
                ]]}}]}
"""))
fig = px.choropleth(gdf, geojson=gdf, color="name", locations="name", featureidkey="properties.name")
fig.update_geos(fitbounds="locations", visible=False)
fig.update_layout(margin={"r": 0, "t": 0, "l": 0, "b": 0})
fig.show()
Note that px.choropleth_mapbox() renders the data correctly.