Here are two snippets which look similar, but behave differently. In each case we generate two overlapping triangles. However the shading in the overlapped region disappears in one case and not the other.
import plotly.graph_objects as go
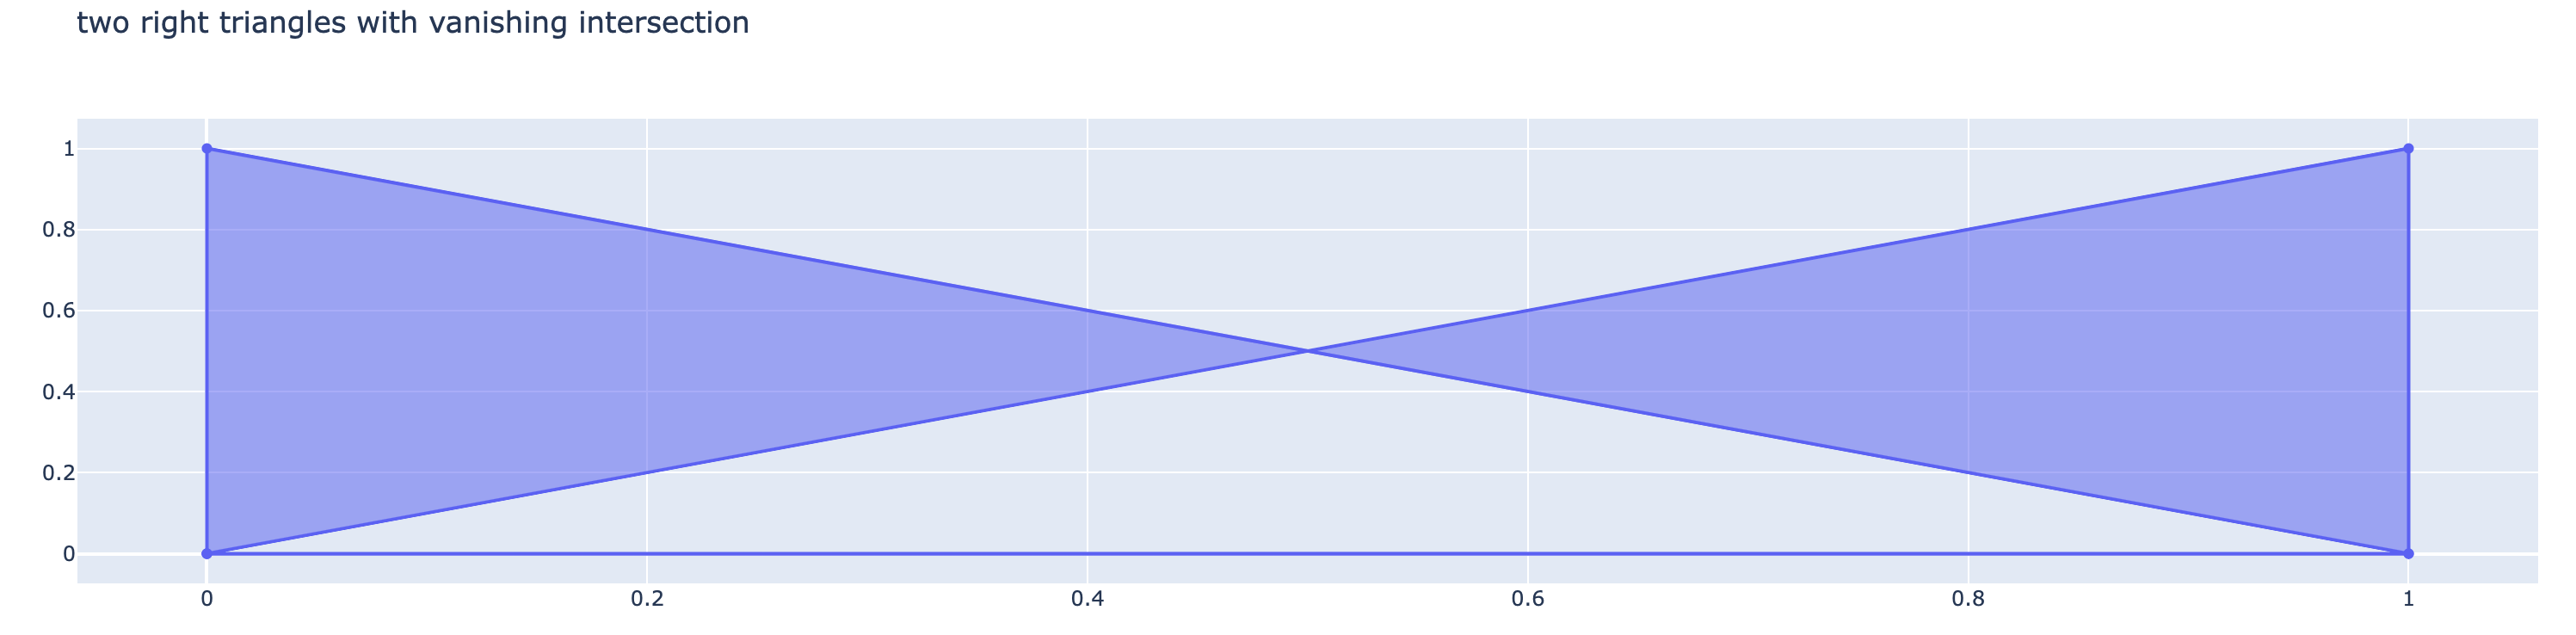
x = [0, 0, 1, 0, None, 0, 1, 1, 0, None ]
y = [0, 1, 0, 0, None, 0, 0, 1, 0, None ]
trace = go.Scatter(x=x, y=y, fill="toself")
fig = go.Figure(data=[trace])
fig.update_layout(title="two right triangles with vanishing intersection")
fig.show()
import plotly.graph_objects as go

x = [0, 1, 2, 0, None, 1, 2, 3, 0, None ]
y = [0, 1, 0, 0, None, 0, 1, 0, 0, None ]
trace = go.Scatter(x=x, y=y, fill="toself")
fig = go.Figure([trace])
fig.update_layout(title="two isoceles triangles with non-vanishing intersection")
fig.show()

Questions
What's the difference between these two examples and how can I make plots that avoid the disappearing intersection behavior?
System details
- Plotly version: 5.14.1
- Python version: Python 3.9.16
Here are two snippets which look similar, but behave differently. In each case we generate two overlapping triangles. However the shading in the overlapped region disappears in one case and not the other.
Questions
What's the difference between these two examples and how can I make plots that avoid the disappearing intersection behavior?
System details