Python script to follow nginx error logs
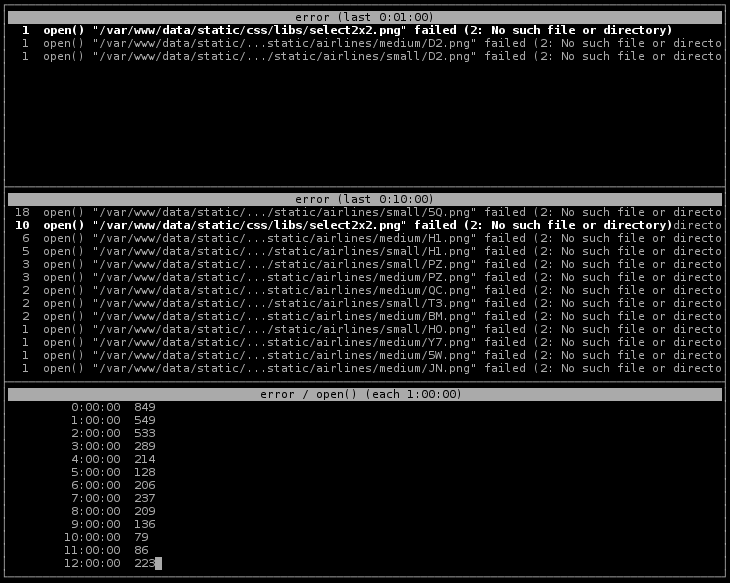
usage: ngxwatcherr.py [-h] [--input FILENAMES] [--period PERIOD] [--offset OFFSET] metric [metric ...]
Valid forms of metrics:
- metric:time
- metric:re:time
- metric/time
- metric/re/time.
"metric" is the element of the error line you want to follow. It is typically "error", "request", "client", etc.
"spec" is a time (1m, 10m, 1h), and is the time range or granularity of the stat.
"re" is a regular expression. Only values for the metric which follow the regexp are counters in the stat. For instance, you migh want to focus on the timeouts in the last 10 minutes (error:timeout:10m)
If separator is :, stat is the list of values for the metric within the time. FOr instance, error:10m displays the errors in the last 10 minutes.
If separator is /, stat is the list of values grouped by time. For instance, error/10m displays the errors grouped by buckets of 10 minutes.
| Command Line Option | Description |
|---|---|
--input FILENAME -f FILENAME |
input file to parse. All are parsed, but only the last one is followed. |
--period PERIOD -s PERIOD |
refresh time (in seconds) |
--offset OFFSET -t OFFSET |
time difference with log file (positive if logs are in the past; negative if logs are in the future). For negative time, use --offset=-2h |