What did you do?
We run a prometheus process that collects relatively small number of metrics (number of series: 30076) with retention.size param set to 1024MB:
bin/prometheus --config.file prometheus.yml --web.enable-admin-api --web.enable-lifecycle --storage.tsdb.retention.size 1024MB --storage.tsdb.retention.time 365d --web.listen-address 0.0.0.0:9123 --storage.tsdb.max-block-duration 25h --storage.tsdb.path /stats_data --log.level debug --query.max-samples 200000 --storage.tsdb.no-lockfile --query.lookback-delta 600s
What did you expect to see?
We expect the disk space taken by prometheus to be limited by approximately 1GB.
What did you see instead? Under which circumstances?
The total size of the data dir has grown higher than 2GB for 3 weeks, and it doesn't seem to have plans to stop. No blocks deleted so far by retention policy.
I added a debug metric that reports the size of each file in the prometheus data dir, and here is what it shows currently:
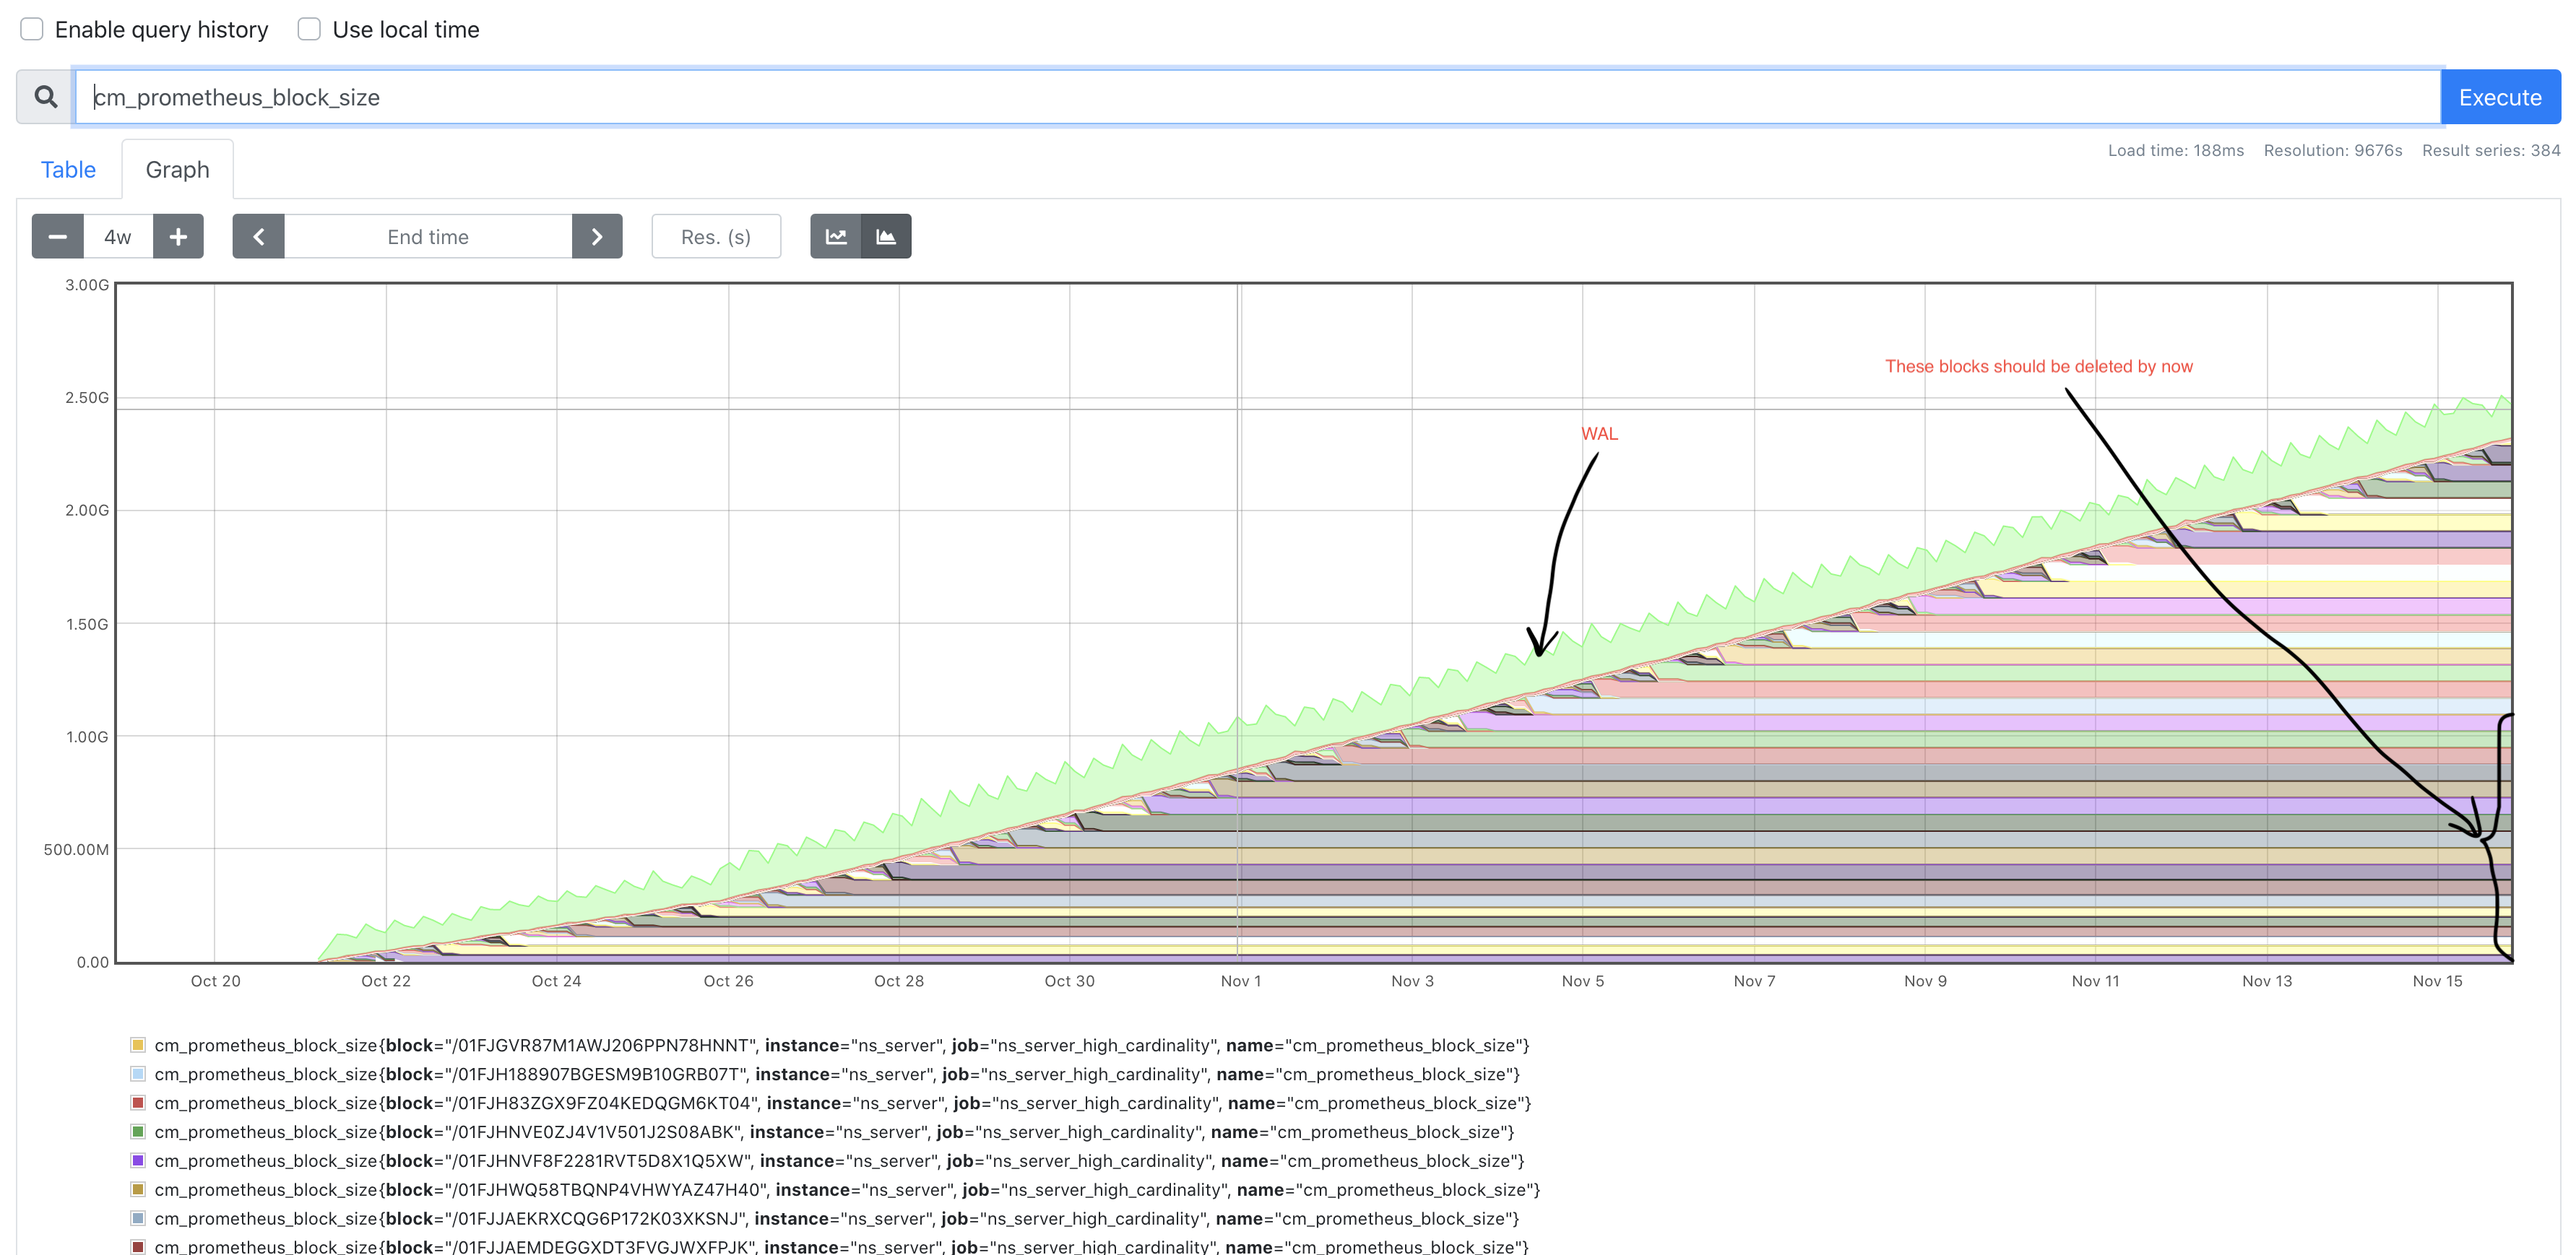
It can be seen clearly that the space is taken not by wal (green), but blocks (which is why I'm creating new issue, because it previous ones the problem was caused by the wal).
Prometheus metrics confirms the problem. prometheus_tsdb_storage_blocks_bytes shows 2.305727921e+09, prometheus_tsdb_size_retentions_total is 0:
# HELP prometheus_tsdb_retention_limit_bytes Max number of bytes to be retained in the tsdb blocks, configured 0 means disabled
# TYPE prometheus_tsdb_retention_limit_bytes gauge
prometheus_tsdb_retention_limit_bytes 1.073741824e+09
# HELP prometheus_tsdb_size_retentions_total The number of times that blocks were deleted because the maximum number of bytes was exceeded.
# TYPE prometheus_tsdb_size_retentions_total counter
prometheus_tsdb_size_retentions_total 0
# HELP prometheus_tsdb_storage_blocks_bytes The number of bytes that are currently used for local storage by all blocks.
# TYPE prometheus_tsdb_storage_blocks_bytes gauge
prometheus_tsdb_storage_blocks_bytes 2.305727921e+09
Environment
uname -srm
Linux 3.10.0-1127.18.2.el7.x86_64 x86_64
 ./prometheus --version
prometheus, version 2.22.0 (branch: HEAD, revision: a6239a377d49104ac7253a99aef8feb8dee0a7c2)
  build user:       couchbase@a18d7aab001f
  build date:       20210701-11:04:06
  go version:       go1.14.2
  platform:         linux/amd64
- Prometheus configuration file:
global:
  scrape_interval: 10s
  scrape_timeout: 10s
  evaluation_interval: 1m
rule_files:
- /opt/couchbase/var/lib/couchbase/config/prometheus_rules.yml
scrape_configs:
- job_name: general
  honor_timestamps: true
  scrape_interval: 10s
  scrape_timeout: 10s
  metrics_path: /_prometheusMetrics
  scheme: http
  basic_auth:
    username: '<user>'
    password_file: <file_path>>
  relabel_configs:
  - source_labels: [__address__]
    separator: ;
    regex: 127\.0\.0\.1:8091
    target_label: instance
    replacement: ns_server
    action: replace
  - source_labels: [__address__]
    separator: ;
    regex: 127\.0\.0\.1:9998
    target_label: instance
    replacement: xdcr
    action: replace
  - source_labels: [__address__]
    separator: ;
    regex: 127\.0\.0\.1:8097
    target_label: instance
    replacement: backup
    action: replace
  - source_labels: [__address__]
    separator: ;
    regex: 127\.0\.0\.1:8095
    target_label: instance
    replacement: cbas
    action: replace
  - source_labels: [__address__]
    separator: ;
    regex: 127\.0\.0\.1:8096
    target_label: instance
    replacement: eventing
    action: replace
  - source_labels: [__address__]
    separator: ;
    regex: 127\.0\.0\.1:8094
    target_label: instance
    replacement: fts
    action: replace
  - source_labels: [__address__]
    separator: ;
    regex: 127\.0\.0\.1:9102
    target_label: instance
    replacement: index
    action: replace
  - source_labels: [__address__]
    separator: ;
    regex: 127\.0\.0\.1:11280
    target_label: instance
    replacement: kv
    action: replace
  - source_labels: [__address__]
    separator: ;
    regex: 127\.0\.0\.1:8093
    target_label: instance
    replacement: n1ql
    action: replace
  static_configs:
  - targets:
    - 127.0.0.1:8091
    - 127.0.0.1:9998
    - 127.0.0.1:8097
    - 127.0.0.1:8095
    - 127.0.0.1:8096
    - 127.0.0.1:8094
    - 127.0.0.1:9102
    - 127.0.0.1:11280
    - 127.0.0.1:8093
- job_name: ns_server_high_cardinality
  honor_timestamps: true
  scrape_interval: 10s
  scrape_timeout: 10s
  metrics_path: /_prometheusMetricsHigh
  scheme: http
  basic_auth:
    username: '<user>'
    password_file: <file_path>>
  relabel_configs:
  - source_labels: [__address__]
    separator: ;
    regex: 127\.0\.0\.1:8091
    target_label: instance
    replacement: ns_server
    action: replace
  static_configs:
  - targets:
    - 127.0.0.1:8091
- job_name: index_high_cardinality
  honor_timestamps: true
  scrape_interval: 3m
  scrape_timeout: 10s
  metrics_path: /_prometheusMetricsHigh
  scheme: http
  basic_auth:
    username: '<user>'
    password_file: <file_path>>
  relabel_configs:
  - source_labels: [__address__]
    separator: ;
    regex: 127\.0\.0\.1:9102
    target_label: instance
    replacement: index
    action: replace
  static_configs:
  - targets:
    - 127.0.0.1:9102
- job_name: fts_high_cardinality
  honor_timestamps: true
  scrape_interval: 3m
  scrape_timeout: 10s
  metrics_path: /_prometheusMetricsHigh
  scheme: http
  basic_auth:
    username: '<user>'
    password_file: <file_path>>
  relabel_configs:
  - source_labels: [__address__]
    separator: ;
    regex: 127\.0\.0\.1:8094
    target_label: instance
    replacement: fts
    action: replace
  static_configs:
  - targets:
    - 127.0.0.1:8094
- job_name: kv_high_cardinality
  honor_timestamps: true
  scrape_interval: 30s
  scrape_timeout: 10s
  metrics_path: /_prometheusMetricsHigh
  scheme: http
  basic_auth:
    username: '<user>'
    password_file: <file_path>>
  relabel_configs:
  - source_labels: [__address__]
    separator: ;
    regex: 127\.0\.0\.1:11280
    target_label: instance
    replacement: kv
    action: replace
  static_configs:
  - targets:
    - 127.0.0.1:11280
- job_name: cbas_high_cardinality
  honor_timestamps: true
  scrape_interval: 3m
  scrape_timeout: 10s
  metrics_path: /_prometheusMetricsHigh
  scheme: http
  basic_auth:
    username: '<user>'
    password_file: <file_path>>
  relabel_configs:
  - source_labels: [__address__]
    separator: ;
    regex: 127\.0\.0\.1:8095
    target_label: instance
    replacement: cbas
    action: replace
  static_configs:
  - targets:
    - 127.0.0.1:8095
- job_name: eventing_high_cardinality
  honor_timestamps: true
  scrape_interval: 3m
  scrape_timeout: 10s
  metrics_path: /_prometheusMetricsHigh
  scheme: http
  basic_auth:
    username: '<user>'
    password_file: <file_path>>
  relabel_configs:
  - source_labels: [__address__]
    separator: ;
    regex: 127\.0\.0\.1:8096
    target_label: instance
    replacement: eventing
    action: replace
  static_configs:
  - targets:
    - 127.0.0.1:8096
- job_name: prometheus
  honor_timestamps: true
  scrape_interval: 1m
  scrape_timeout: 1m
  metrics_path: /metrics
  scheme: http
  basic_auth:
    username: '<user>'
    password_file: <file_path>>
  relabel_configs:
  - separator: ;
    regex: (.*)
    target_label: instance
    replacement: prometheus
    action: replace
  metric_relabel_configs:
  - source_labels: [__name__]
    separator: ;
    regex: prometheus_target_interval_length_seconds_sum|prometheus_target_interval_length_seconds|prometheus_target_interval_length_seconds_count
    replacement: $1
    action: drop
  static_configs:
  - targets:
    - 127.0.0.1:9123
`
- Logs:
Compaction logs look ok to me:
level=info ts=2021-11-15T11:00:01.524Z caller=compact.go:494 component=tsdb msg="write block" mint=1636963200000 maxt=1636970400000 ulid=01FMHM1YGSTJ034XP1EJY8KDJX duration=859.002235ms
level=info ts=2021-11-15T11:00:01.588Z caller=head.go:809 component=tsdb msg="Head GC completed" duration=21.097557ms
level=info ts=2021-11-15T11:00:01.605Z caller=checkpoint.go:96 component=tsdb msg="Creating checkpoint" from_segment=300 to_segment=301 mint=1636970400000
level=info ts=2021-11-15T11:00:02.792Z caller=head.go:889 component=tsdb msg="WAL checkpoint complete" first=300 last=301 duration=1.18719712s
Sometimes it takes longer though. It even removes something, but it is not retention related as I see all the metrics data is there and extractable.
level=info ts=2021-11-15T15:00:01.420Z caller=compact.go:494 component=tsdb msg="write block" mint=1636977600000 maxt=1636984800000 ulid=01FMJ1SD0T73Y99SJYAXP0QT56 duration=754.197257ms
level=info ts=2021-11-15T15:00:01.485Z caller=head.go:809 component=tsdb msg="Head GC completed" duration=22.259144ms
level=info ts=2021-11-15T15:00:01.502Z caller=checkpoint.go:96 component=tsdb msg="Creating checkpoint" from_segment=302 to_segment=303 mint=1636984800000
level=info ts=2021-11-15T15:00:02.658Z caller=head.go:889 component=tsdb msg="WAL checkpoint complete" first=302 last=303 duration=1.155751244s
level=info ts=2021-11-15T15:00:04.062Z caller=compact.go:440 component=tsdb msg="compact blocks" count=3 mint=1636956000000 maxt=1636977600000 ulid=01FMJ1SF0NVA1Z4QG91CNEZH2Y sources="[01FMHD678TC75EFFYE77VY9V46 01FMHM1YGSTJ034XP1EJY8KDJX 01FMHTXNRSTTW2TYXSJKAGSH8K]" duration=1.353403267s
level=info ts=2021-11-15T15:00:04.125Z caller=db.go:1152 component=tsdb msg="Deleting obsolete block" block=01FMHD678TC75EFFYE77VY9V46
level=info ts=2021-11-15T15:00:04.129Z caller=db.go:1152 component=tsdb msg="Deleting obsolete block" block=01FMHTXNRSTTW2TYXSJKAGSH8K
level=info ts=2021-11-15T15:00:04.133Z caller=db.go:1152 component=tsdb msg="Deleting obsolete block" block=01FMHM1YGSTJ034XP1EJY8KDJX
level=info ts=2021-11-15T15:00:05.812Z caller=compact.go:440 component=tsdb msg="compact blocks" count=3 mint=1636912800000 maxt=1636977600000 ulid=01FMJ1SGEBBETEPNDMTQGNMM3J sources="[01FMGRK5Y79ZQ71GDGFGGW8P24 01FMHD68C916T7RVG5Q6AG8K6P 01FMJ1SF0NVA1Z4QG91CNEZH2Y]" duration=1.641333967s
level=info ts=2021-11-15T15:00:05.858Z caller=db.go:1152 component=tsdb msg="Deleting obsolete block" block=01FMJ1SF0NVA1Z4QG91CNEZH2Y
level=info ts=2021-11-15T15:00:05.867Z caller=db.go:1152 component=tsdb msg="Deleting obsolete block" block=01FMGRK5Y79ZQ71GDGFGGW8P24
level=info ts=2021-11-15T15:00:05.875Z caller=db.go:1152 component=tsdb msg="Deleting obsolete block" block=01FMHD68C916T7RVG5Q6AG8K6P
What did you do?
We run a prometheus process that collects relatively small number of metrics (number of series: 30076) with retention.size param set to 1024MB:
What did you expect to see?
We expect the disk space taken by prometheus to be limited by approximately 1GB.
What did you see instead? Under which circumstances?
The total size of the data dir has grown higher than 2GB for 3 weeks, and it doesn't seem to have plans to stop. No blocks deleted so far by retention policy.
I added a debug metric that reports the size of each file in the prometheus data dir, and here is what it shows currently:
It can be seen clearly that the space is taken not by wal (green), but blocks (which is why I'm creating new issue, because it previous ones the problem was caused by the wal).
Prometheus metrics confirms the problem. prometheus_tsdb_storage_blocks_bytes shows 2.305727921e+09, prometheus_tsdb_size_retentions_total is 0:
Environment
`
Compaction logs look ok to me:
Sometimes it takes longer though. It even removes something, but it is not retention related as I see all the metrics data is there and extractable.