Thanks for your reply, But I have same problem of plot station wind.
Original issue: #216
proplot verions: 0.6.4
My observe data as follow:
import pandas as pd
df = pd.DataFrame({'stationd_id':['54511','54512'],'lon':[117,120],'lat':[27,25],'u':[2,4],'v':[4,2]})
print(df)
Results:
  stationd_id  lon  lat  u  v
0       54511  117   27  2  4
1       54512  120   25  4  2
Then draw code:
import proplot as plot
f, axs = plot.subplots(ncols=1, nrows=1, figsize=(14,12),proj='pcarree' )
axs.format(
    labels=True,latlines=1, lonlines=1,lonlim=(115,122),latlim=(20,28),
    suptitle=''
)
axs[0].barbs( df['lon'], df['lat'], df['u'], df['v'], linewidth=0.5,pivot='middle')
Error:
~\miniconda3\envs\metenv\lib\site-packages\proplot\axes\plot.py in standardize_2d(self, func, autoformat, order, globe, *args, **kwargs)

    692         Z = _to_arraylike(Z)
    693         if Z.ndim != 2:
--> 694             raise ValueError(f'Z must be 2-dimensional, got shape {Z.shape}.')
    695         Zs.append(Z)
    696     if not all(Zs[0].shape == Z.shape for Z in Zs):

ValueError: Z must be 2-dimensional, got shape (2,).
if I plot 2d grid data, it's works.
2d data is xarray DataArray:
import xarray as np
ds_10u = xr.open_dataset('ec.oper.an.sfc.128_165_10u.regn1280sc.20210116.grb',engine='cfgrib',backend_kwargs={'indexpath':''})
ds_10v = xr.open_dataset('ec.oper.an.sfc.128_166_10v.regn1280sc.20210116.grb',engine='cfgrib',backend_kwargs={'indexpath':''})
print(ds_10u)
Results:
<xarray.Dataset>
Dimensions:     (latitude: 569, longitude: 284)
Coordinates:
    number      int32 ...
    time        datetime64[ns] 2021-01-16
    step        timedelta64[ns] ...
    surface     float64 ...
  * latitude    (latitude) float64 69.98 69.91 69.84 69.77 ... 30.19 30.12 30.05
  * longitude   (longitude) float64 105.0 105.1 105.2 ... 124.8 124.9 124.9
    valid_time  datetime64[ns] ...
Data variables:
    u10         (latitude, longitude) float32 ...
Attributes:
    GRIB_edition:            1
    GRIB_centre:             ecmf
    GRIB_centreDescription:  European Centre for Medium-Range Weather Forecasts
    GRIB_subCentre:          0
    Conventions:             CF-1.7
    institution:             European Centre for Medium-Range Weather Forecasts
    history:                 2021-07-04T03:43 GRIB to CDM+CF via cfgrib-0.9.9...
Then plot 10u and 10v
import numpy as np
import proplot as plot
_space = 5
f, axs = plot.subplots(ncols=1, nrows=1, figsize=(12,8),proj='pcarree' )
axs.format(
    labels=True,latlines=1, lonlines=1,lonlim=(115,125),latlim=(20,26),
    suptitle=''
)
levels = np.linspace(0,17,18)

im = axs[0].contourf(ds_10u.longitude, ds_10v.latitude, (ds_10u.u10 ** 2 + ds_10v.v10 ** 2) ** 0.5, levels=levels,
                     cmap=cmaps.wind_17lev, extend='max')
axs[0].colorbar(im, loc='b', length=1)

axs[0].barbs( ds_10u.longitude[::_space], ds_10v.latitude[::_space], ds_10u.u10[::_space,::_space], ds_10v.v10[::_space,::_space],
             sizes=dict(emptybarb=0), barb_increments={'half':2,'full':4,'flag':20},length=6, linewidth=0.5,pivot='middle')

axs.coastlines('50m', linewidth=0.8)
Results:

And matplotlib barbs is support plot 1d data.
Example code:
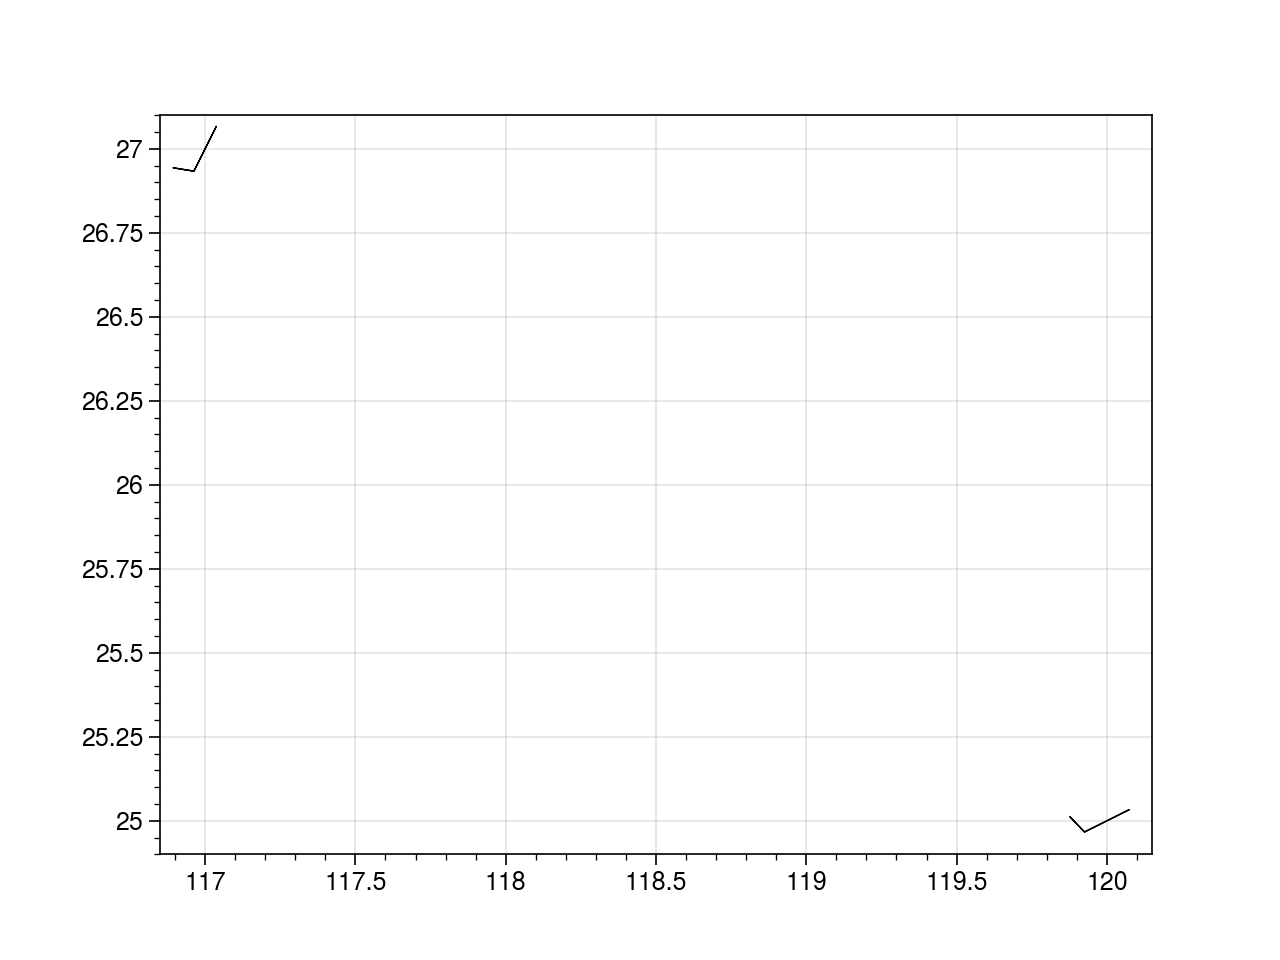
import matplotlib.pyplot as plt
fig, axs = plt.subplots(nrows=1, ncols=1)
axs.barbs(df['lon'], df['lat'], df['u'], df['v'],
             sizes=dict(emptybarb=0), barb_increments={'half':2,'full':4,'flag':20},length=6, linewidth=0.5,pivot='middle')
Results:
change linewidth=5:
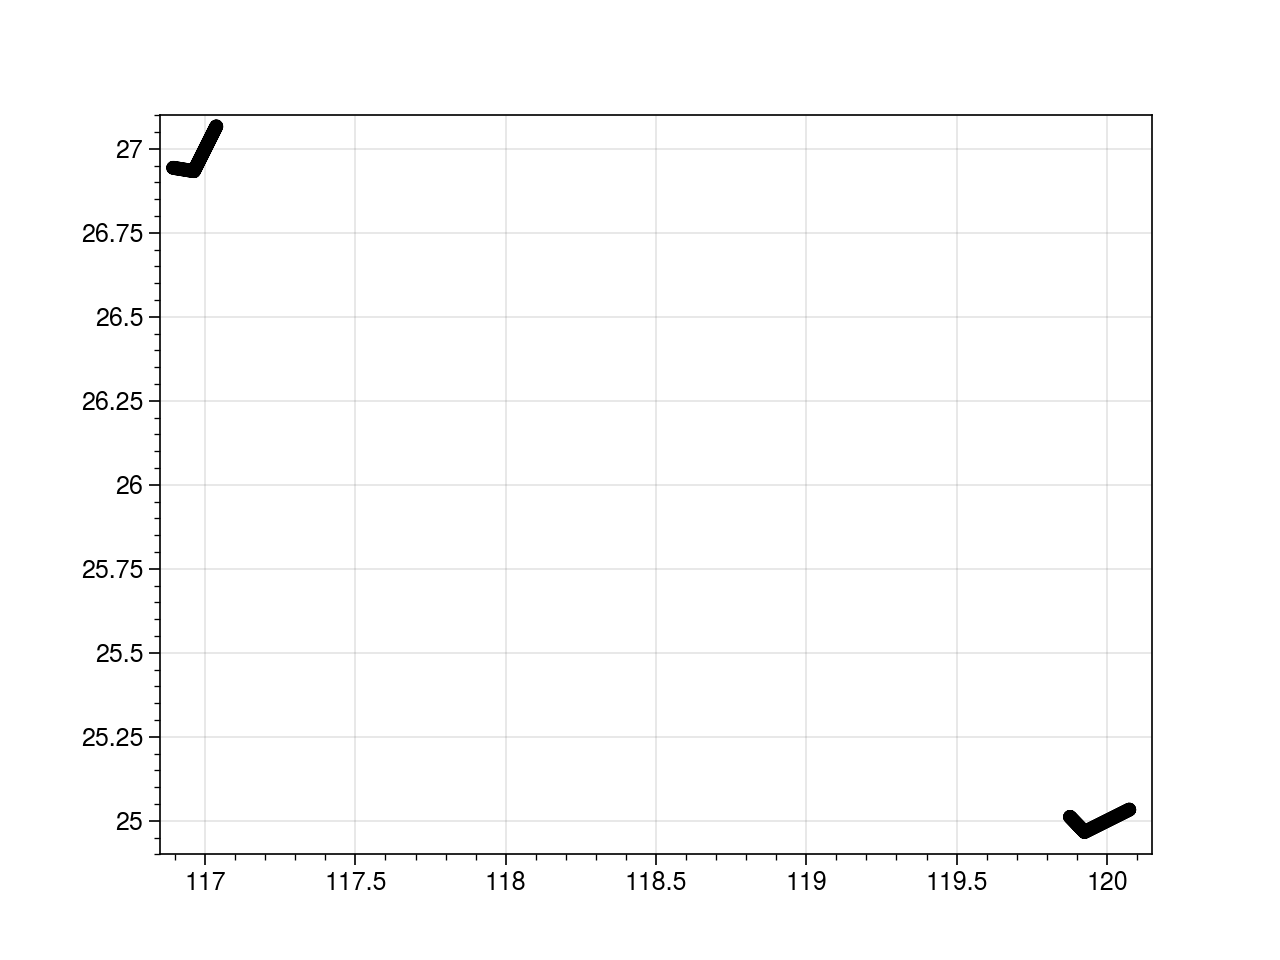
Proplot does not seem to support one-dimensional data to plot barbs..
Looking forward to your reply.
Sincerely
Thanks for your reply, But I have same problem of plot station wind.
Original issue: #216
proplot verions: 0.6.4
My observe data as follow:
Results:
Then draw code:
Error:
if I plot 2d grid data, it's works.
2d data is xarray DataArray:
Results:
Then plot
10uand10vResults:

And matplotlib
barbsis support plot 1d data.Example code:
Results:

change

linewidth=5:Proplot does not seem to support one-dimensional data to plot barbs..
Looking forward to your reply.
Sincerely