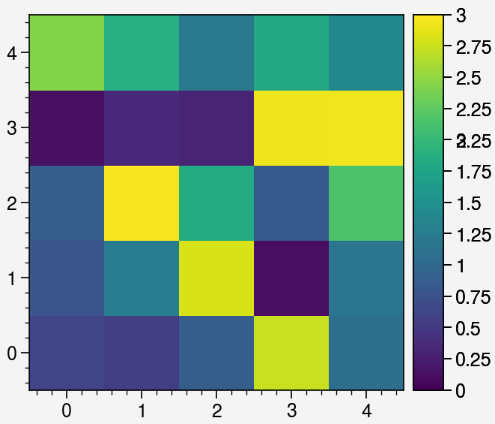
Description
Sometimes there're duplicated ticks shown on the colorbar.
Steps to reproduce
fig, axs = pplt.subplots()
import numpy as np

Z = np.random.rand(5, 5)*3
m = axs.pcolormesh(Z, cmap='viridis', levels=256, vmin=0, vmax=3)
axs.colorbar(m, ticks=0.25)
Expected behavior: [What you expected to happen]
The label of 2 tick shouldn't be overlayed with 2.25
Actual behavior: [What actually happened]
Proplot version
matplotlib: 3.5.0
proplot: 0.9.5.post78
Description
Sometimes there're duplicated ticks shown on the colorbar.
Steps to reproduce
Expected behavior: [What you expected to happen]
The label of
2tick shouldn't be overlayed with2.25Actual behavior: [What actually happened]

Proplot version