Changing the legend fontsize #331
Description
Description
Should one be able to set fontsize directly in the call to ax.legend()? To make the legend fontsize smaller or larger, I have to update the rc settings ahead of time since ax.legend(fontsize='small') has no effect.
Steps to reproduce
s = np.sin(np.deg2rad(pplt.arange(0,360)))*pplt.arange(1,6).reshape(6,1)

x=np.deg2rad(pplt.arange(0,360))
y=s.T

labels = np.char.add(np.array(['Line ']*6),pplt.arange(1,6).astype('str'))

fig = pplt.figure(refaspect=(2,1.5), share=False)
axs = fig.subplots(ncols=2)

axs.format(xlim=(0,2*np.pi), xlocator=np.pi/2, xformatter='pi')

p0 = axs[0].plot(x=x, y=y, cycle='FlatUI', labels=labels)
p1 = axs[1].plot(x=x, y=y, cycle='FlatUI', labels=labels)

#Setting fontsize has no effect
axs[0].legend(p0, loc='ll', ncol=2, frame=False, fontsize='small')

#Have to set legend.fontsize separately to set to 'small'
with pplt.rc.context({'legend.fontsize': 'small'}):
    axs[1].legend(p1, loc='ll', ncol=2, frame=False)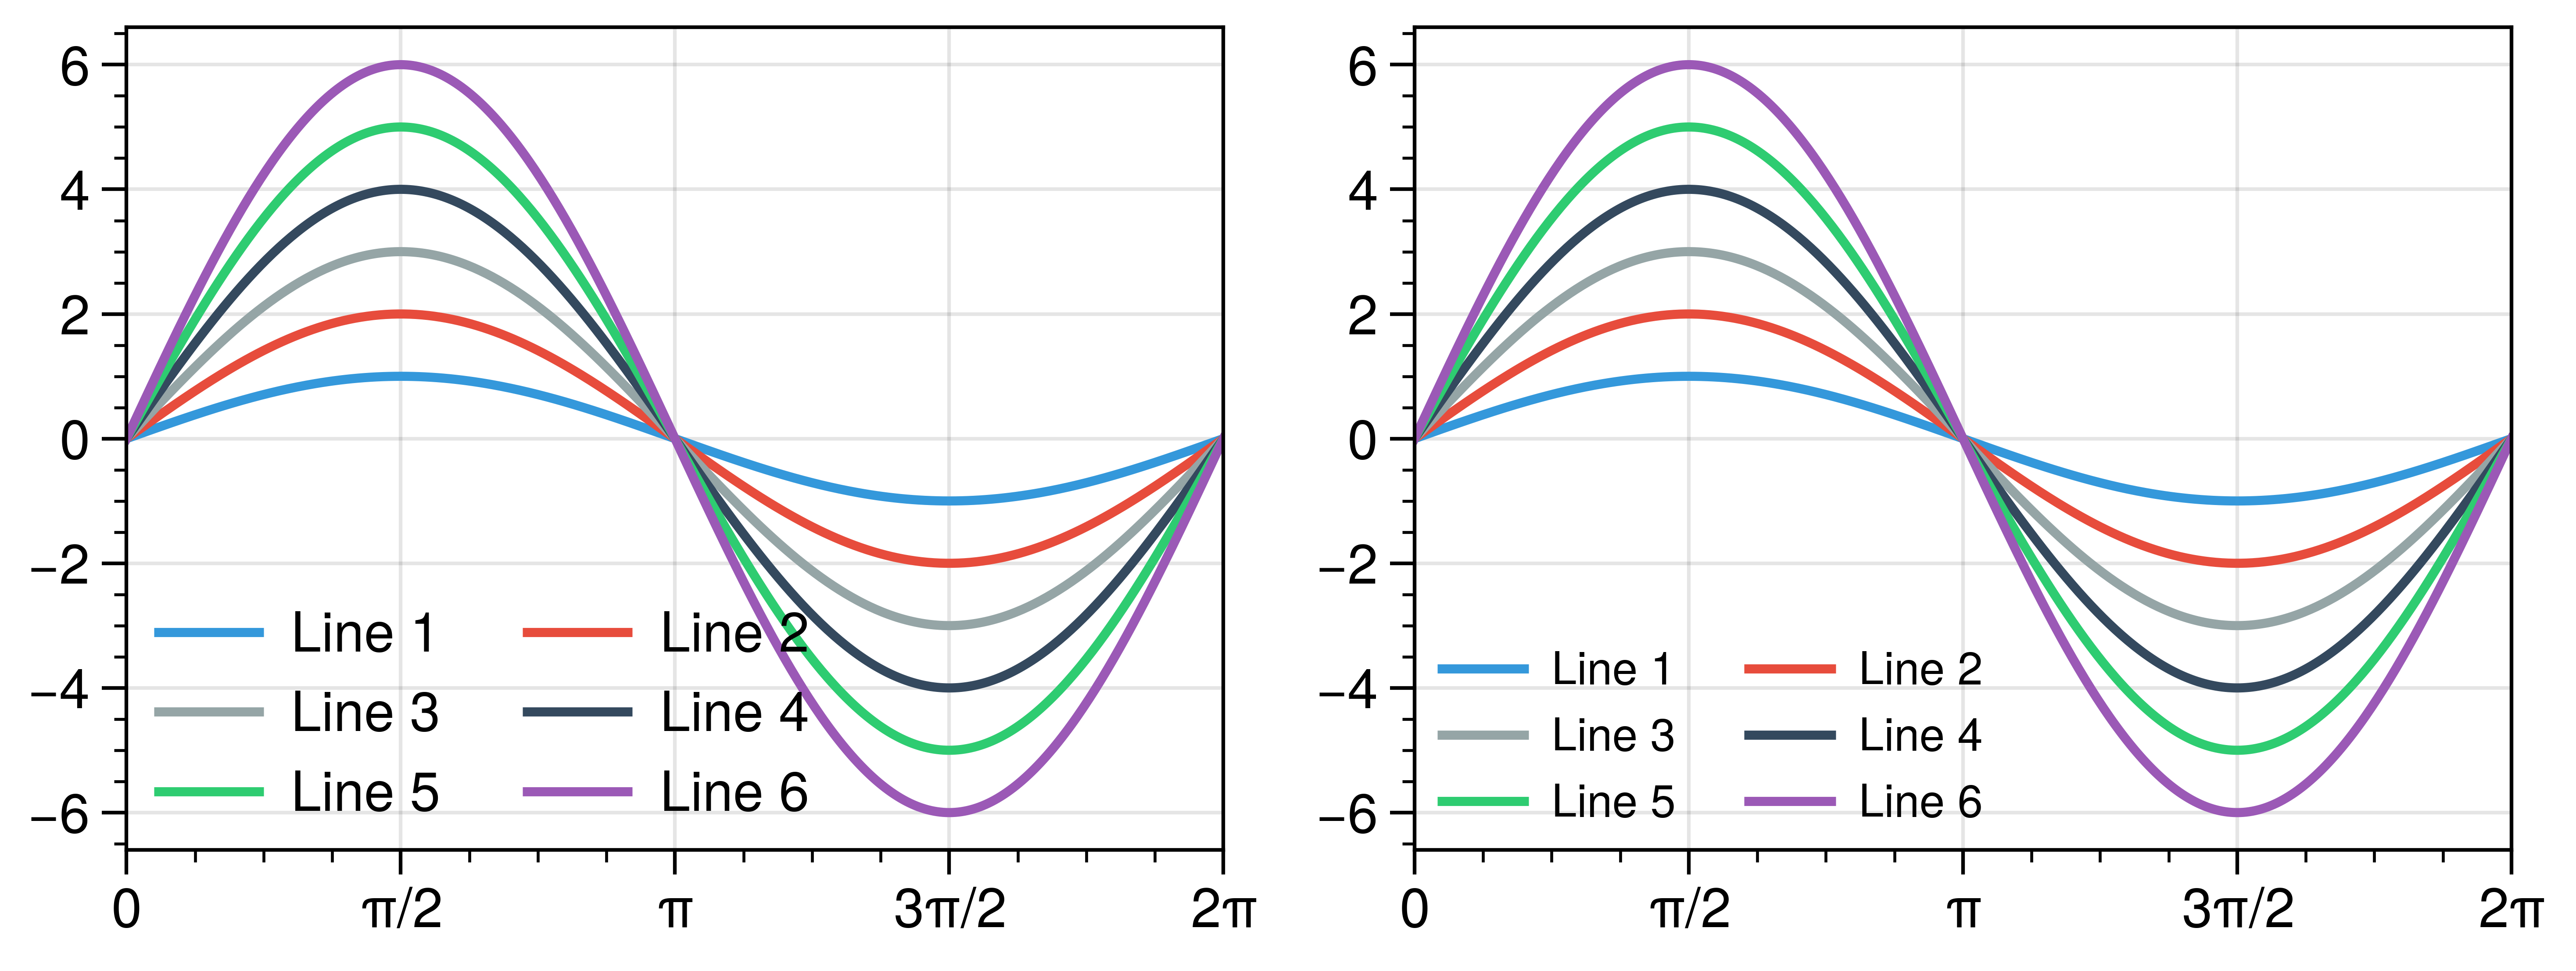
Expected behavior: Be able to change the legend fontsize directly in ax.legend()
Actual behavior: ax.legend(fontsize='small') has no effect
Equivalent steps in matplotlib
import matplotlib.pyplot as plt
import numpy as np

s = np.sin(np.deg2rad(np.arange(0,361)))*np.arange(1,7).reshape(6,1)

x=np.deg2rad(np.arange(0,361))
y=s.T

labels = np.char.add(np.array(['Line ']*6),np.arange(1,7).astype('str'))

fig = plt.figure(figsize=(10,4))
axs = fig.subplots(ncols=2)

p0 = axs[0].plot(x, y, label=labels)
p1 = axs[1].plot(x, y, label=labels)

#Setting fontsize works
axs[0].legend()
axs[1].legend(fontsize='small')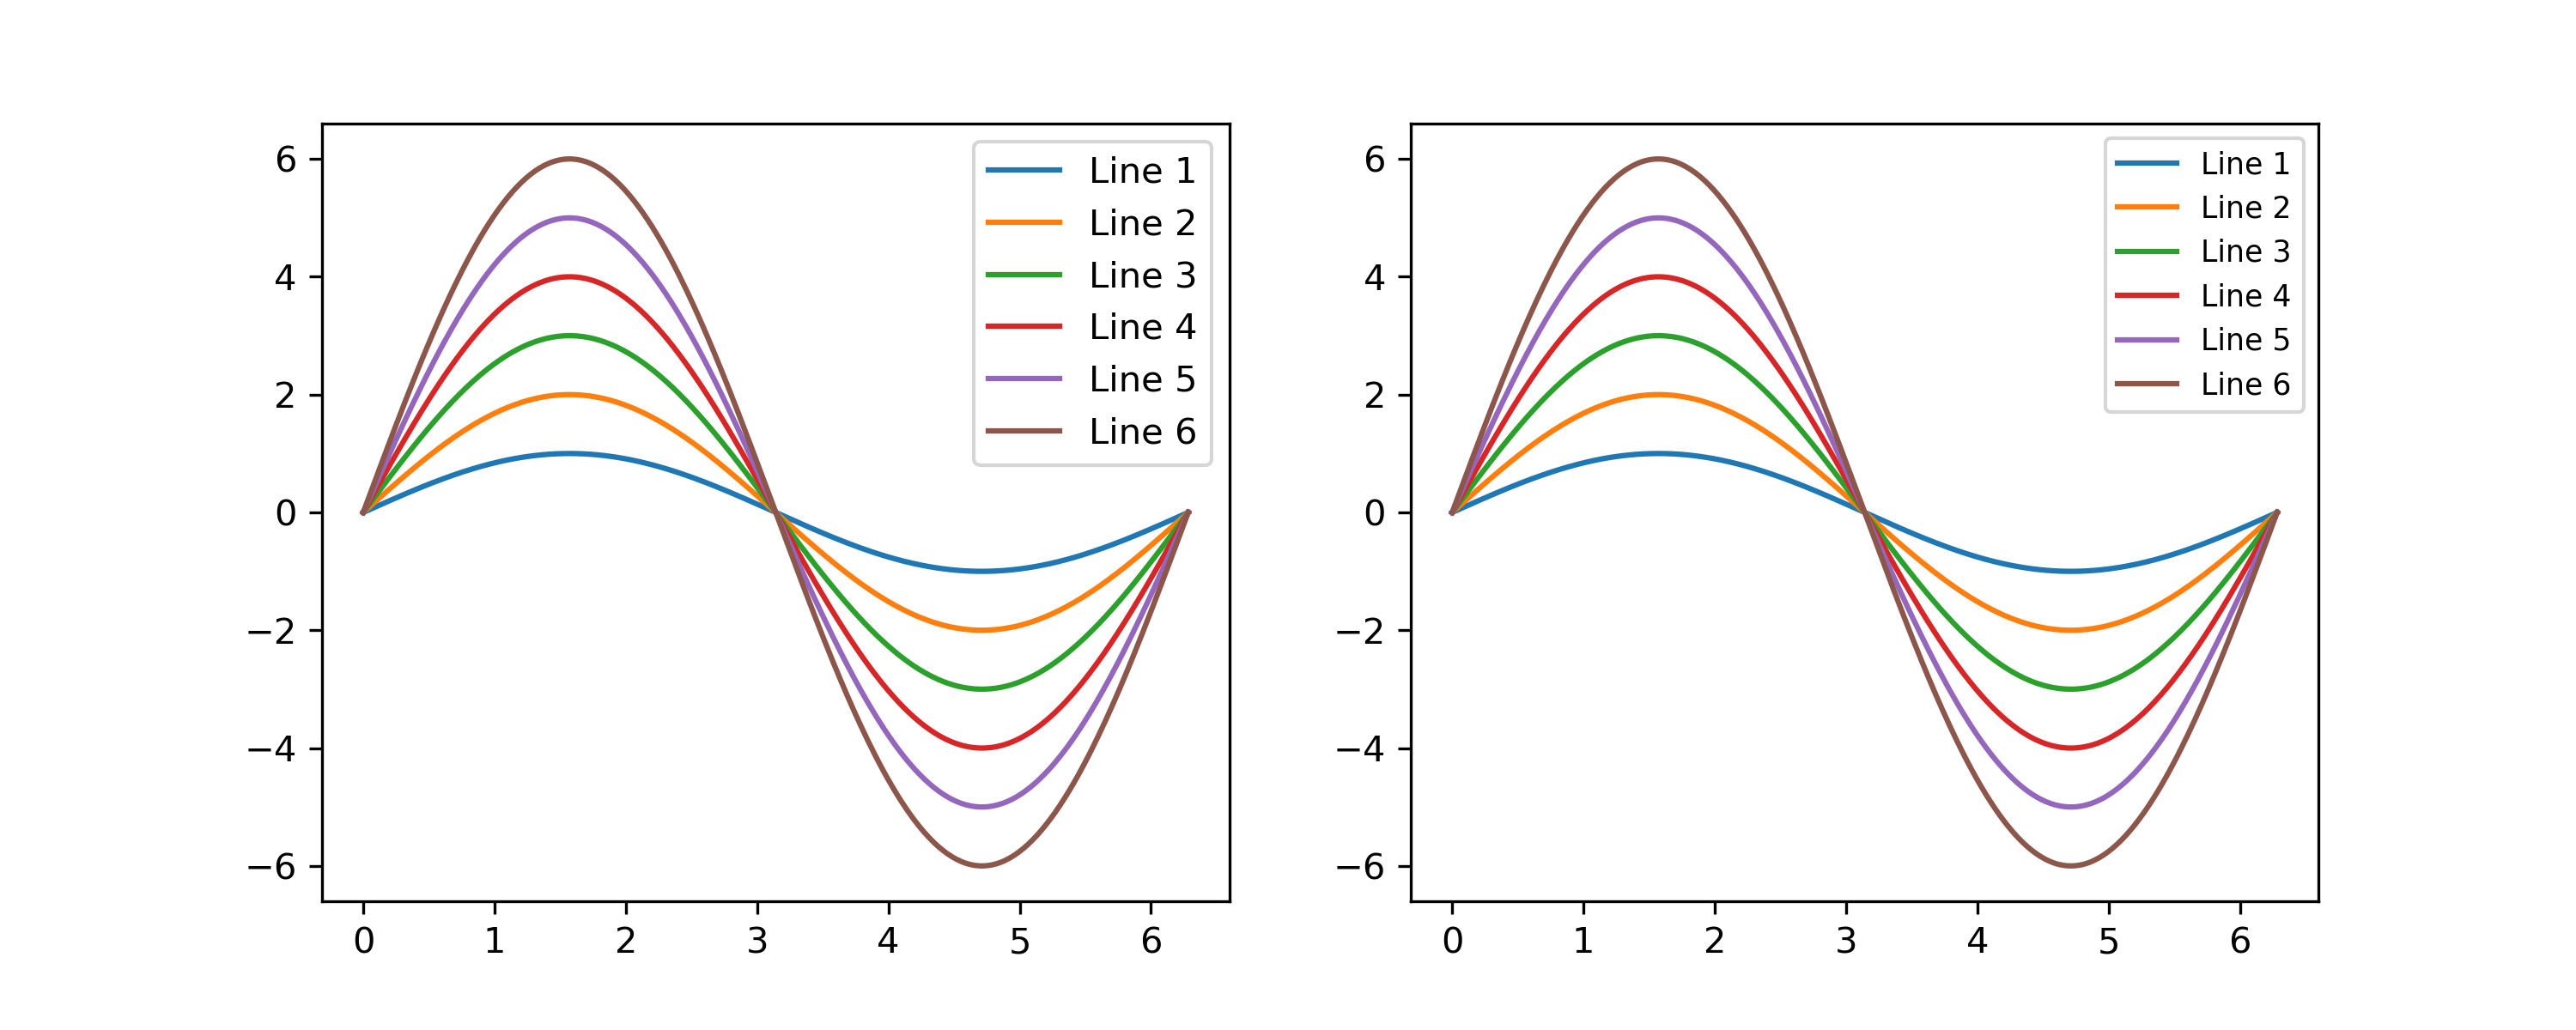
Proplot version
matplotlib 3.4.3
proplot 0.9.5