Terminal Dashboard
cronstable tui is the web dashboard's terminal
sibling: the same board, keyboard-first, rendered in your terminal — an
SSH session, a tmux pane, a serial console, a box where a browser is one
window too many. It is a client of the same
HTTP Control API the web page uses, so there is nothing
extra to enable on the daemon: if the dashboard works, so does the TUI.
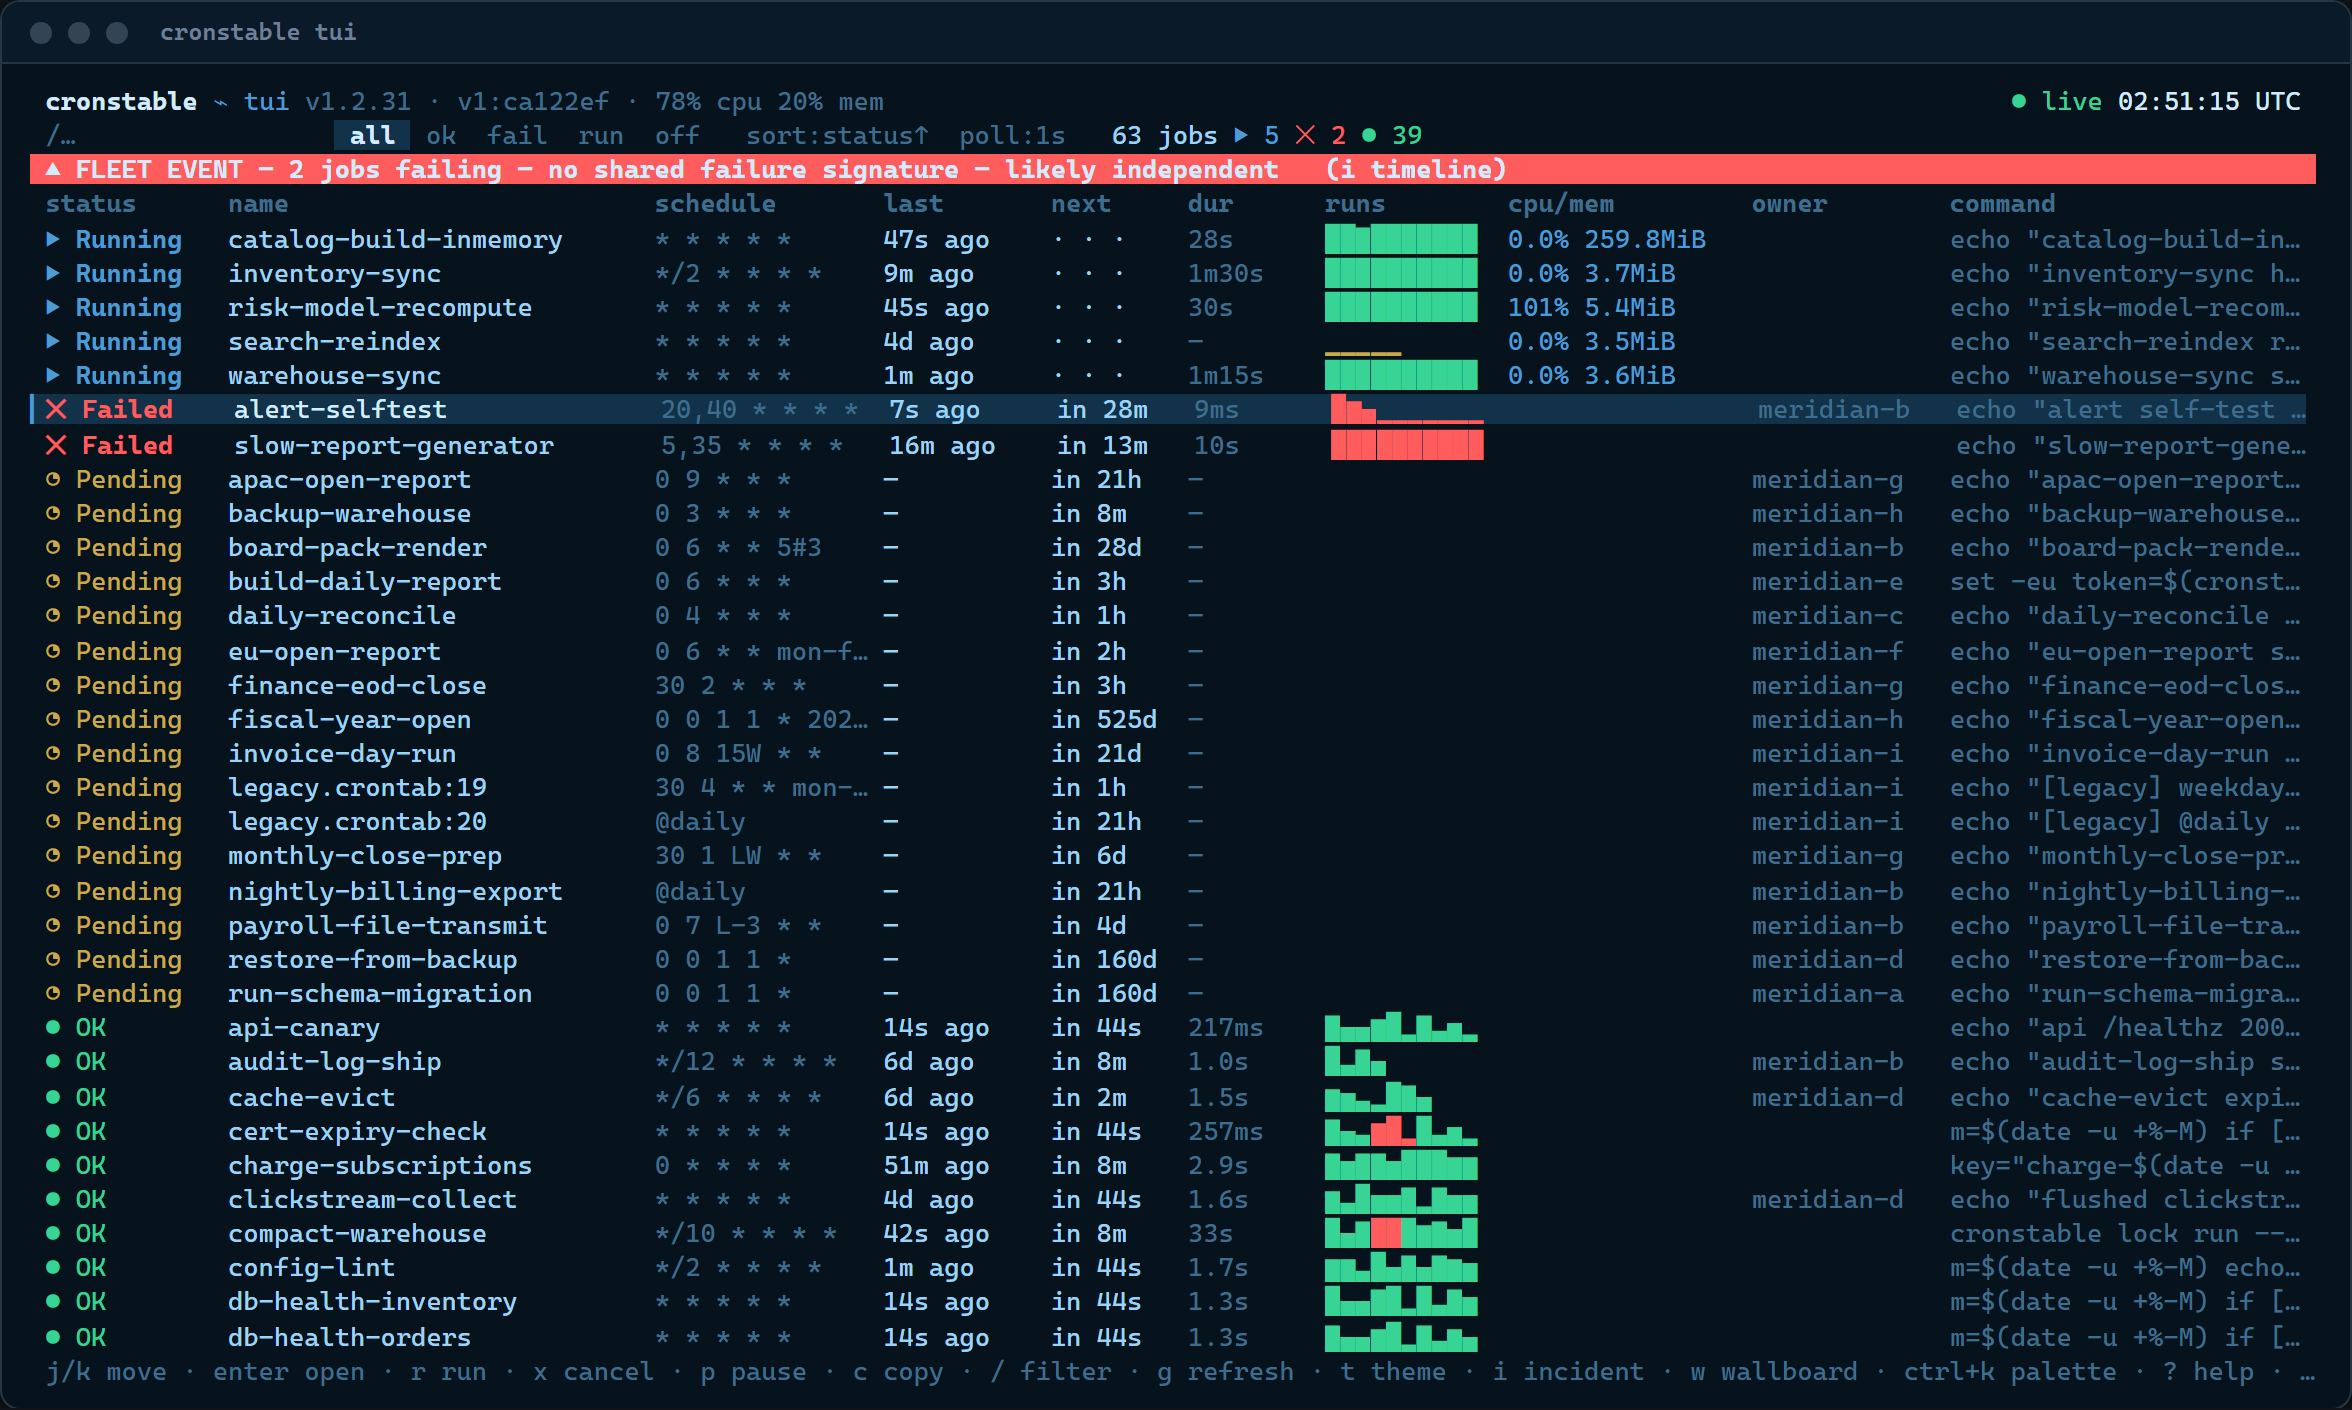
(Every screenshot on this page's README section is the real TUI driven against the running grand tour fleet — the same one the web dashboard's screenshots use.)
cronstable tui                              # local daemon on :8080
cronstable tui --url http://prod-node:8080  # a remote daemon
cronstable tui --tv                         # straight to the wallboard
cronstable tui --job nightly-backup         # deep-link a job's drawer
It is hand-rolled on the standard library plus the core aiohttp
dependency (the same zero-new-dependency rule as the
MCP server), works on Linux, macOS and Windows, and ships in the
same package and binaries as the daemon.
| Flag | Meaning |
|---|---|
--url URL |
Daemon web listener (default http://127.0.0.1:8080). |
--token TOKEN |
Bearer token for web.authToken-protected daemons. |
--token-env VAR |
Env var to read the token from when --token is absent (default CRONSTABLE_WEB_TOKEN). |
--theme NAME |
Start on a theme (carolina, amber, green, modern, standard, each also as NAME-light); persisted. |
--tv |
Start on the wallboard, like opening the page at #tv. |
--job NAME |
Open a job's drawer at startup, like #job/NAME. |
--poll SECONDS |
Refresh interval; 0 pauses (default: remembered, else 3). |
--boot / --no-boot
|
Force or skip the boot self-test. |
--ascii |
Plain-ASCII status glyphs for limited fonts/terminals. |
The web page's shortcut table applies verbatim — the two frontends share
one muscle memory. Press ? at any time for the overlay.
| Key | Action |
|---|---|
Ctrl-K / Ctrl-P
|
Open the command palette |
/ |
Focus the filter |
j / ↓, k / ↑
|
Select the next / previous job |
Enter |
Open the selected job |
r / x
|
Run / cancel the selected job |
c |
Copy the selected job's command |
g |
Refresh now |
t / T
|
Cycle theme / flip phosphor ↔ paper |
i |
Incident timeline |
w |
Wallboard (TV) mode |
a |
Acknowledge the failure alarm |
? |
The shortcut overlay |
Esc |
Close the open panel or drawer |
Terminal-only extras (grouped separately in the ? overlay): q quits,
s/S cycle the sort key/direction, f cycles the status filter,
m opens the multi-tail console, ←/→ (or Tab) switch drawer
tabs, PgUp/PgDn scroll, and inside the Logs tab f/t/w toggle
follow/timestamps/wrap, / searches with n/N for next/previous
match, and d saves the log to a file.
Everything an operator drives from the web page:
- the jobs board — status glyphs, next-fire countdowns, last-run ages, duration sparklines, live CPU/memory chips for monitored jobs, the owner column under a spread cluster, filtering, sorting, and the status segments;
- the job drawer — the live SSE log tail (ANSI colors re-inked per theme, search, follow, wrap, timestamps, save-to-file), run history with success rate and per-run bars, resources for monitored jobs, and the schedule tab, whose plain-English text and next-fire preview come from the daemon's own cron engine;
- the fuzzy command palette, with the same global, per-job, and per-DAG actions;
- the verdict bar and incident timeline with the same failure-correlation logic ("×4 share exit=69 — likely one cause"), and the mitigate console with staggered bulk start/cancel, abort, and a Markdown incident writeup (saved to a file and copied);
- the multi-tail console — up to four jobs' live logs merged with identity-colored prefixes;
- the DAG drawer — runs, an ASCII task graph, per-task states and
attempts, approval gates (
aapprove /Rreject), XCom values, task logs, trigger and backfill; - the cluster panel, fleet matrix (jobs × nodes, failing-only filter), node resources, activity heatmap punchcard, and next-fire radar;
- the state inspector for the durable store (inventory, document namespaces, record streams);
- the cron sandbox (
Ctrl-K→ "Cron sandbox"), evaluating expressions live against the daemon's own engine; - the wallboard (
w) with worst-first tiles, the tally foot, aNO SIGNALbanner when data goes stale, and the zen screensaver on an idle, healthy board; - the BIOS-style boot self-test, probing the daemon for real, once
per 12 hours (skippable with any key,
--no-boot, or a settings toggle).
Web-only physics stay in the browser: CRT glow, scanlines, desktop notifications (the TUI rings the terminal bell instead, off by default), the run ledger, and the pendulum wordmark.
The same five hues as the web page — carolina (default), amber and
green phosphor, flat modern and standard — each in a dark
(phosphor) and light (paper) variant; t cycles hues and T flips the
variant, exactly as in the browser. The color-vision remaps
(red-green and blue-yellow) re-ink the status colors with the same
shape-differs-too guarantee, and --ascii swaps the status glyphs for
plain ASCII. Preferences (theme, refresh, toggles) persist in a small
JSON file — %APPDATA%\cronstable\tui.json on Windows,
$XDG_CONFIG_HOME/cronstable/tui.json (or ~/.config/...) elsewhere —
the TUI's analogue of the page's localStorage.
With web.authToken enabled, pass the token
with --token, or export it and let the default --token-env CRONSTABLE_WEB_TOKEN pick it up. Exactly like the page, an
unauthenticated start is fine: the first 401 opens the token prompt,
and the token is kept for the session only (never written to the prefs
file). Mutating keys (r, x, DAG trigger/backfill/decision) go
through the same POST endpoints, and the daemon's cross-site Origin
gate does not apply to a native client, so no extra configuration is
needed.
The same endpoints, on the same cadence model, as the web page: GET /jobs on the refresh interval (1s–10s or paused, default 3s), with
/cluster and /node riding each successful poll; /fleet, /state,
and the heatmap's batched /jobs/{name}/runs only while their panels
are open; GET /jobs/{name}/logs as a Server-Sent-Events stream while
a Logs tab or multi-tail pane is attached (replay-then-follow, with the
page's same reconnect throttle). Run cronstable tui against any
daemon you can curl.
- Web Dashboard: the browser original — every surface the TUI mirrors, annotated with screenshots.
- HTTP Control API: the endpoints and authentication both frontends are built on.
- MCP: the third frontend — the same daemon, for AI agents.