Web Dashboard
yacron2 includes a built-in web dashboard: a single, self-contained HTML page
(one inline <script>, inline styles, no external assets, no build step, and no
database) served by the optional HTTP Control API. It turns the daemon
into a live, keyboard-driven control room. Watch every job's status, tail its
output as it runs, review run history, and preview upcoming schedules, all from a
browser.
The dashboard is part of the HTTP interface, so it appears as soon as you add a
web section with at least one http:// listener (see
HTTP Control API for the full configuration reference):
web:
  listen:
    - http://127.0.0.1:8080
Open the listener's root path in a browser, http://127.0.0.1:8080/ for the
example above. The page is served at / on every http:// listener and is
self-contained, so nothing else needs to be installed or hosted.
The HTML document is returned with defense-in-depth security headers, including a
strict Content-Security-Policy (default-src 'self', connect-src 'self',
frame-ancestors 'none', anti-clickjacking X-Frame-Options: DENY, and
X-Content-Type-Options: nosniff). Any header you set under web.headers is
merged on top of these defaults, so you can relax or extend them deliberately.
To expose only the REST API and not the dashboard, set ui: false:
web:
  listen:
    - http://127.0.0.1:8080
  ui: false
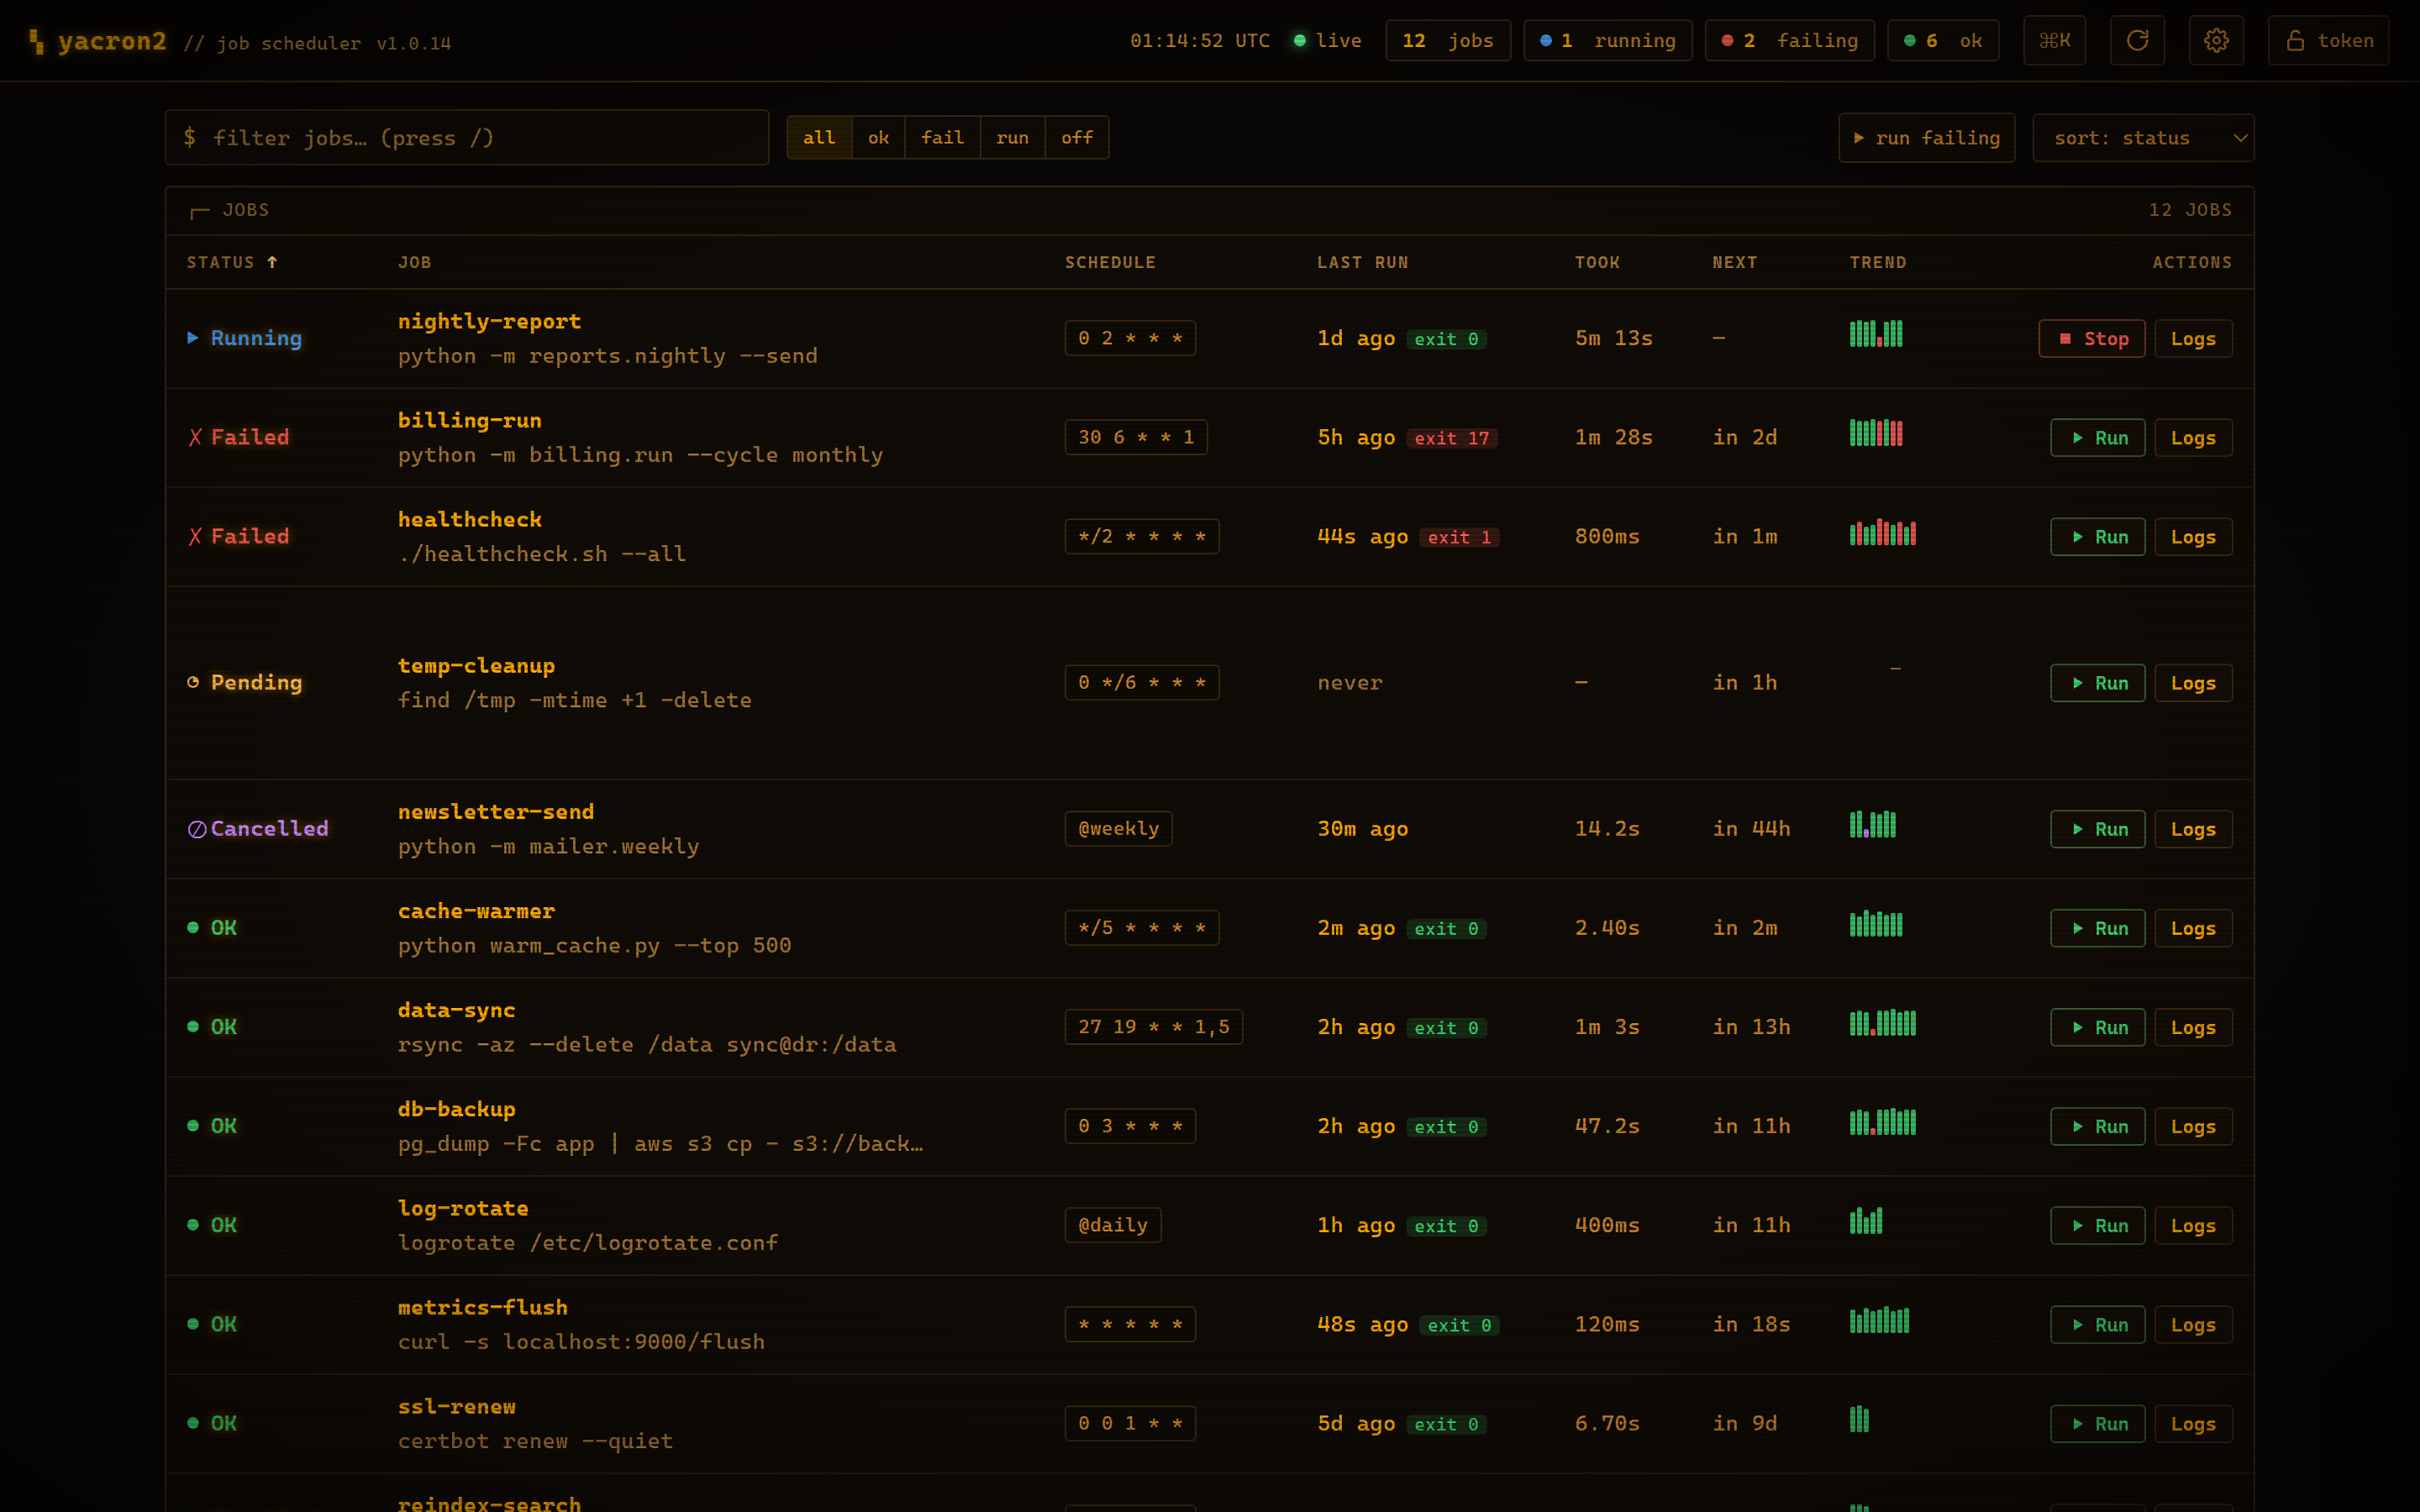
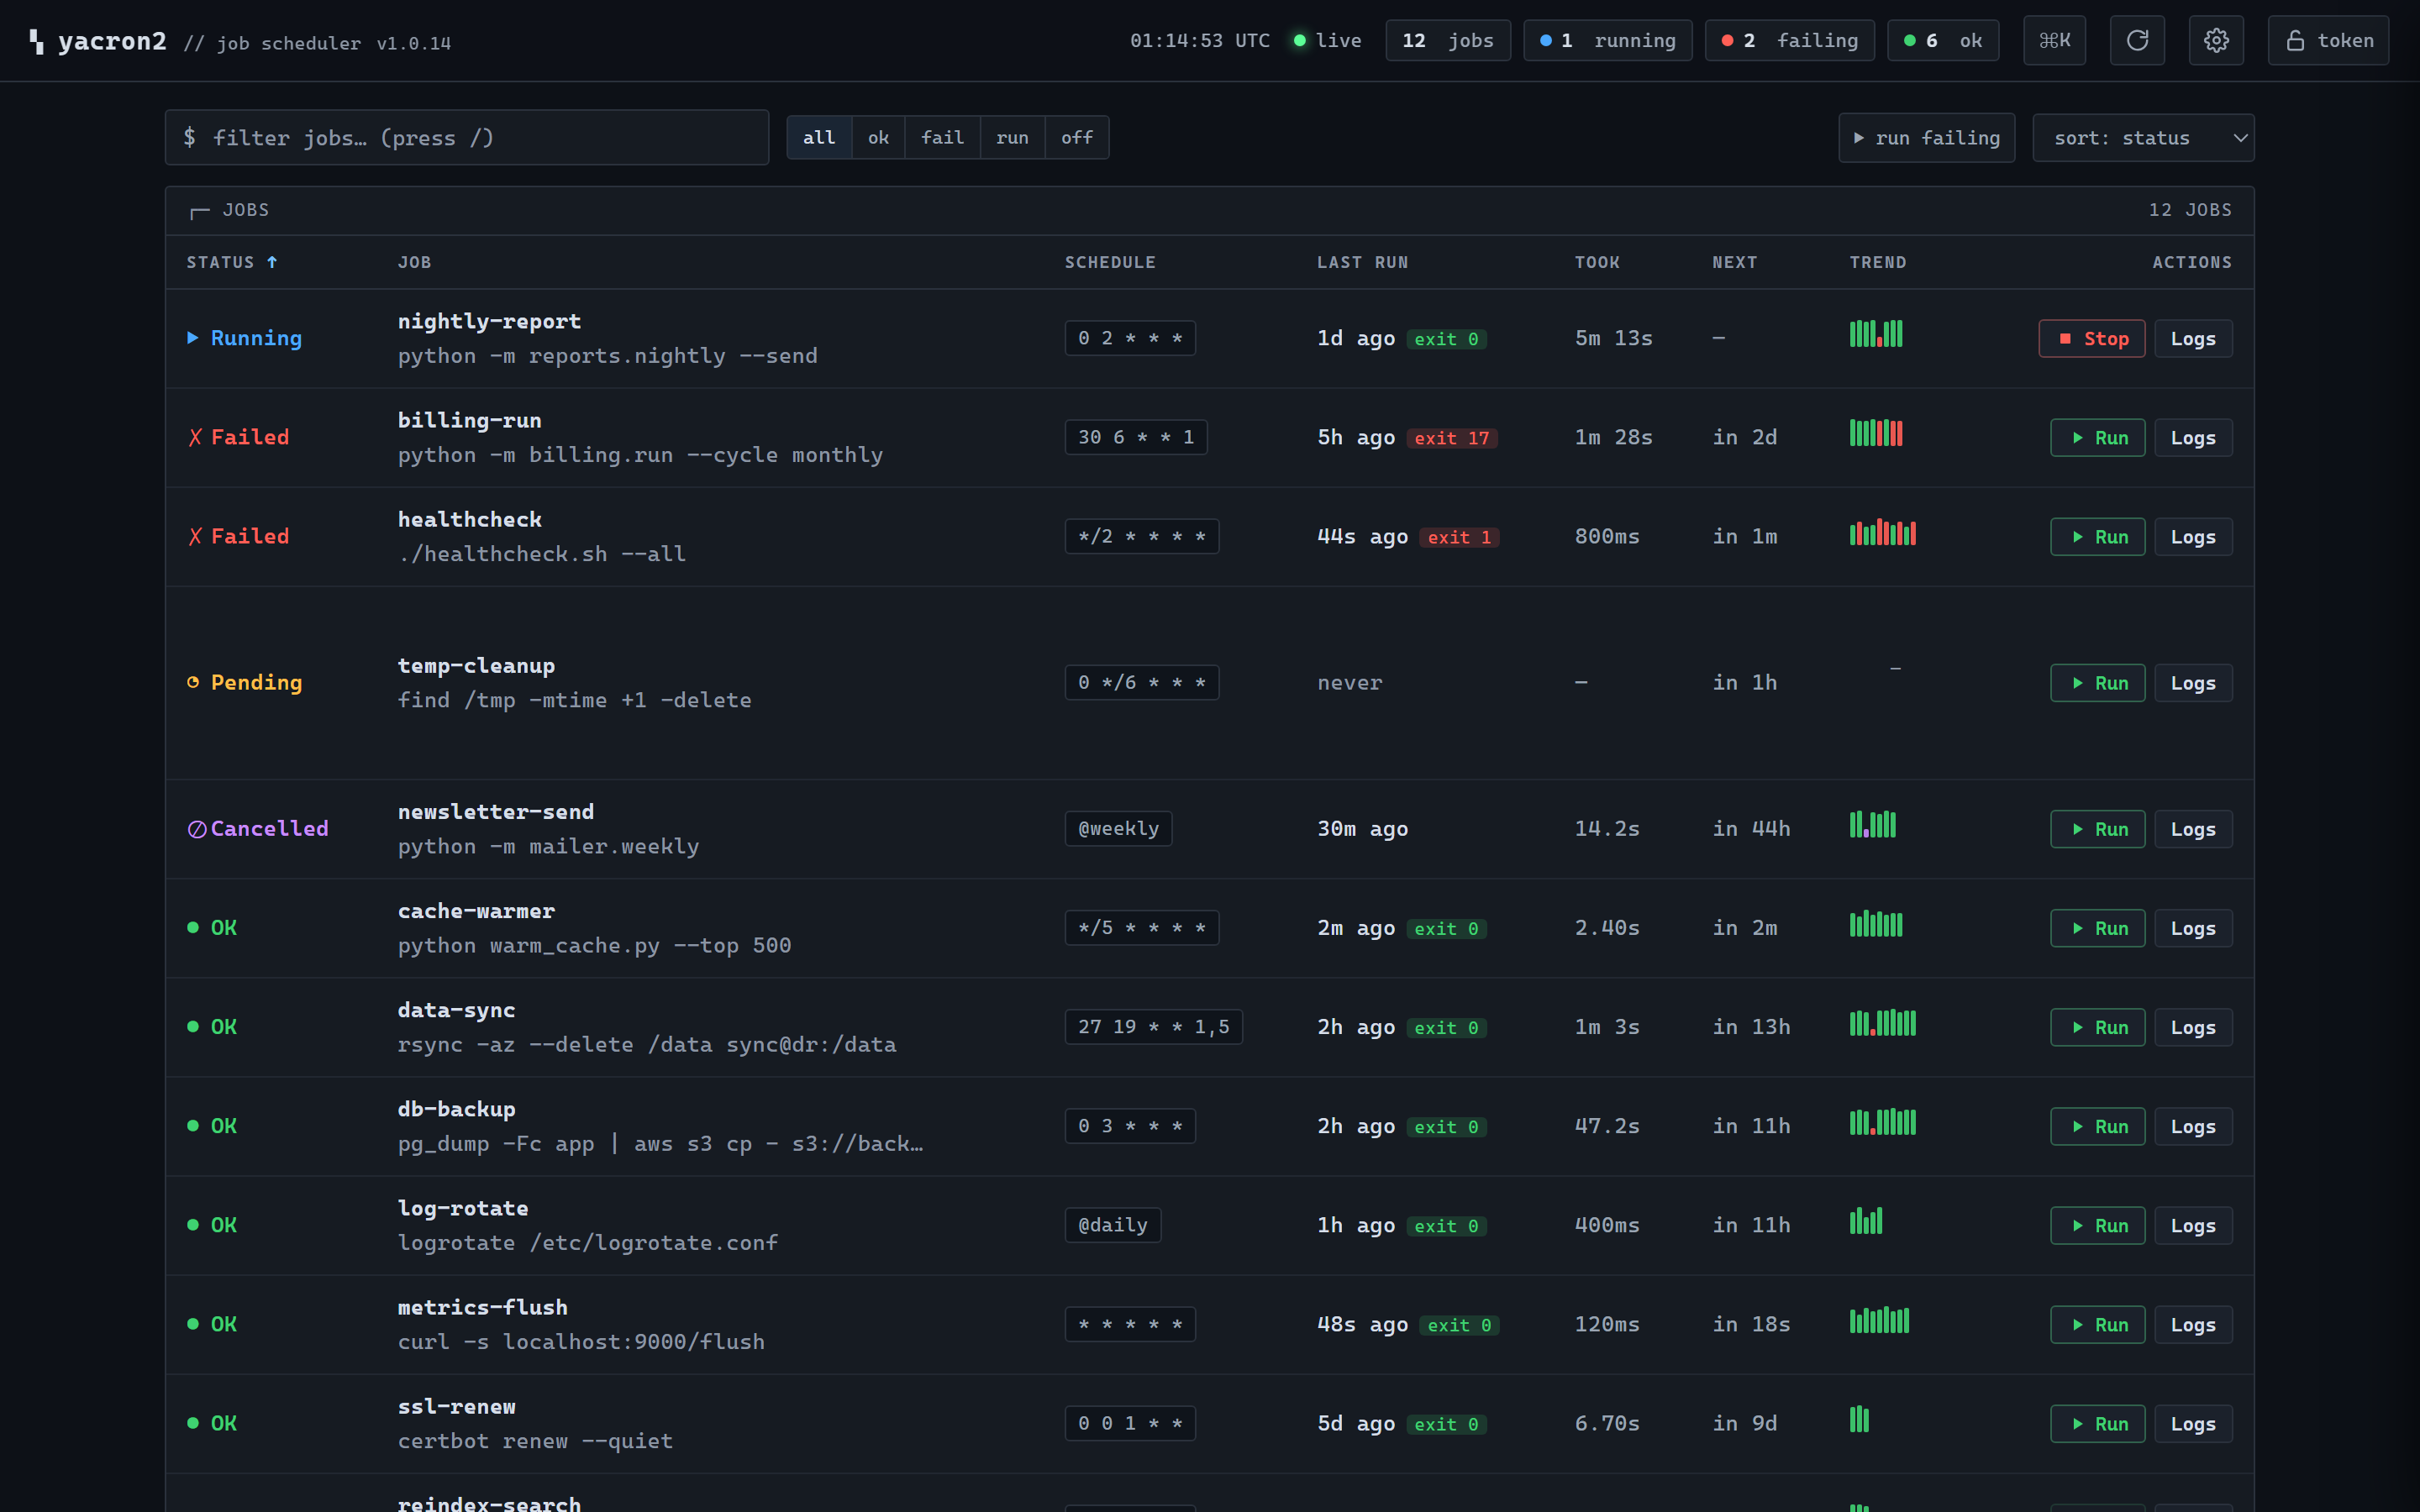
The landing page is a single sortable, filterable table of every configured job.
The header carries a live UTC clock, a connection indicator (live when the
server is responding, no signal when polls are failing; hover it to see how
long ago the last successful response arrived), and summary pills counting the
total jobs and how many are running, failing, and OK.
Each row shows:
| Column | What it shows |
|---|---|
| Status | The job's current health: one of Running, Failed, OK, Pending (enabled but never run yet), Cancelled, or Disabled (enabled: false), each with a color and glyph. |
| Job | The job name and its command. |
| Owner |
(cluster only, under distribution: spread) the node that currently owns the job. The jobs owned by the node you're viewing are highlighted in the accent color, so you can see at a glance which work lands here; EveryNode jobs read all nodes, and a Leader job with no quorum reads no quorum. The column is hidden entirely outside spread mode. Sortable, so you can group jobs by node. |
| Schedule | The raw schedule string; hover it for a plain-English reading. |
| Last run | How long ago the last run finished (kept fresh every second) and an exit-code badge. |
| Took | The last run's duration. |
| Next | A live countdown to the next scheduled run (— while running or disabled). |
| Trend | A sparkline of recent runs: one bar per run, height by duration, colored by outcome. |
| Actions | One-click Run (or Stop, for a running job) and Logs. |
The ⊞ cols button in the table header opens a column picker, so you can trim the table down or add columns that are off by default (the choice is remembered per browser). The page widens to give opted-in columns real room, and the table scrolls horizontally if the window still can't fit everything. The optional columns:
| Column | What it shows |
|---|---|
| Policy |
(cluster only) the job's clusterPolicy: Leader, PreferLeader, or EveryNode; hover for what the policy means. Standalone daemons show —. Sortable, to group jobs by policy. |
| TZ | The schedule's reference frame: UTC (the default), the job's IANA timezone (e.g. America/Los_Angeles), or local (utc: false). Handy when a fleet mixes frames. |
| Next at | The next run as a wall-clock time in your browser's timezone (04:00, tom 04:00, Jul 12 04:00), the absolute complement to Next's countdown. |
| Rate | The success percentage over the recent runs the sparkline draws, colored green / amber / red, a numeric complement to Trend. |
The toolbar above the table lets you:
-
filter by typing in the search box (matches name or command; press
/to focus it); - narrow by status with the all / ok / fail / run / off segmented control;
- sort by name, status, last run, next run, or duration (from the dropdown, or by clicking a column header, including the optional columns; clicking again reverses);
- run every failing job at once with the run failing button.
Clicking a job (or pressing Enter on the selected row) opens a detail drawer
with three tabs: Logs, History, and Schedule. The drawer header
repeats the job's status, schedule (with its plain-English reading), the running
PID(s), and a one-click button to copy the command. When
leader election is enabled, the
header also shows the job's active clusterPolicy (Leader,
PreferLeader, or EveryNode), and under
distribution: spread
the node that currently owns the job (e.g. cluster: Leader → yacron-c).
Jobs are deep-linkable:
opening a job updates the URL to #job/<name>, so you can bookmark or share a
direct link to it.
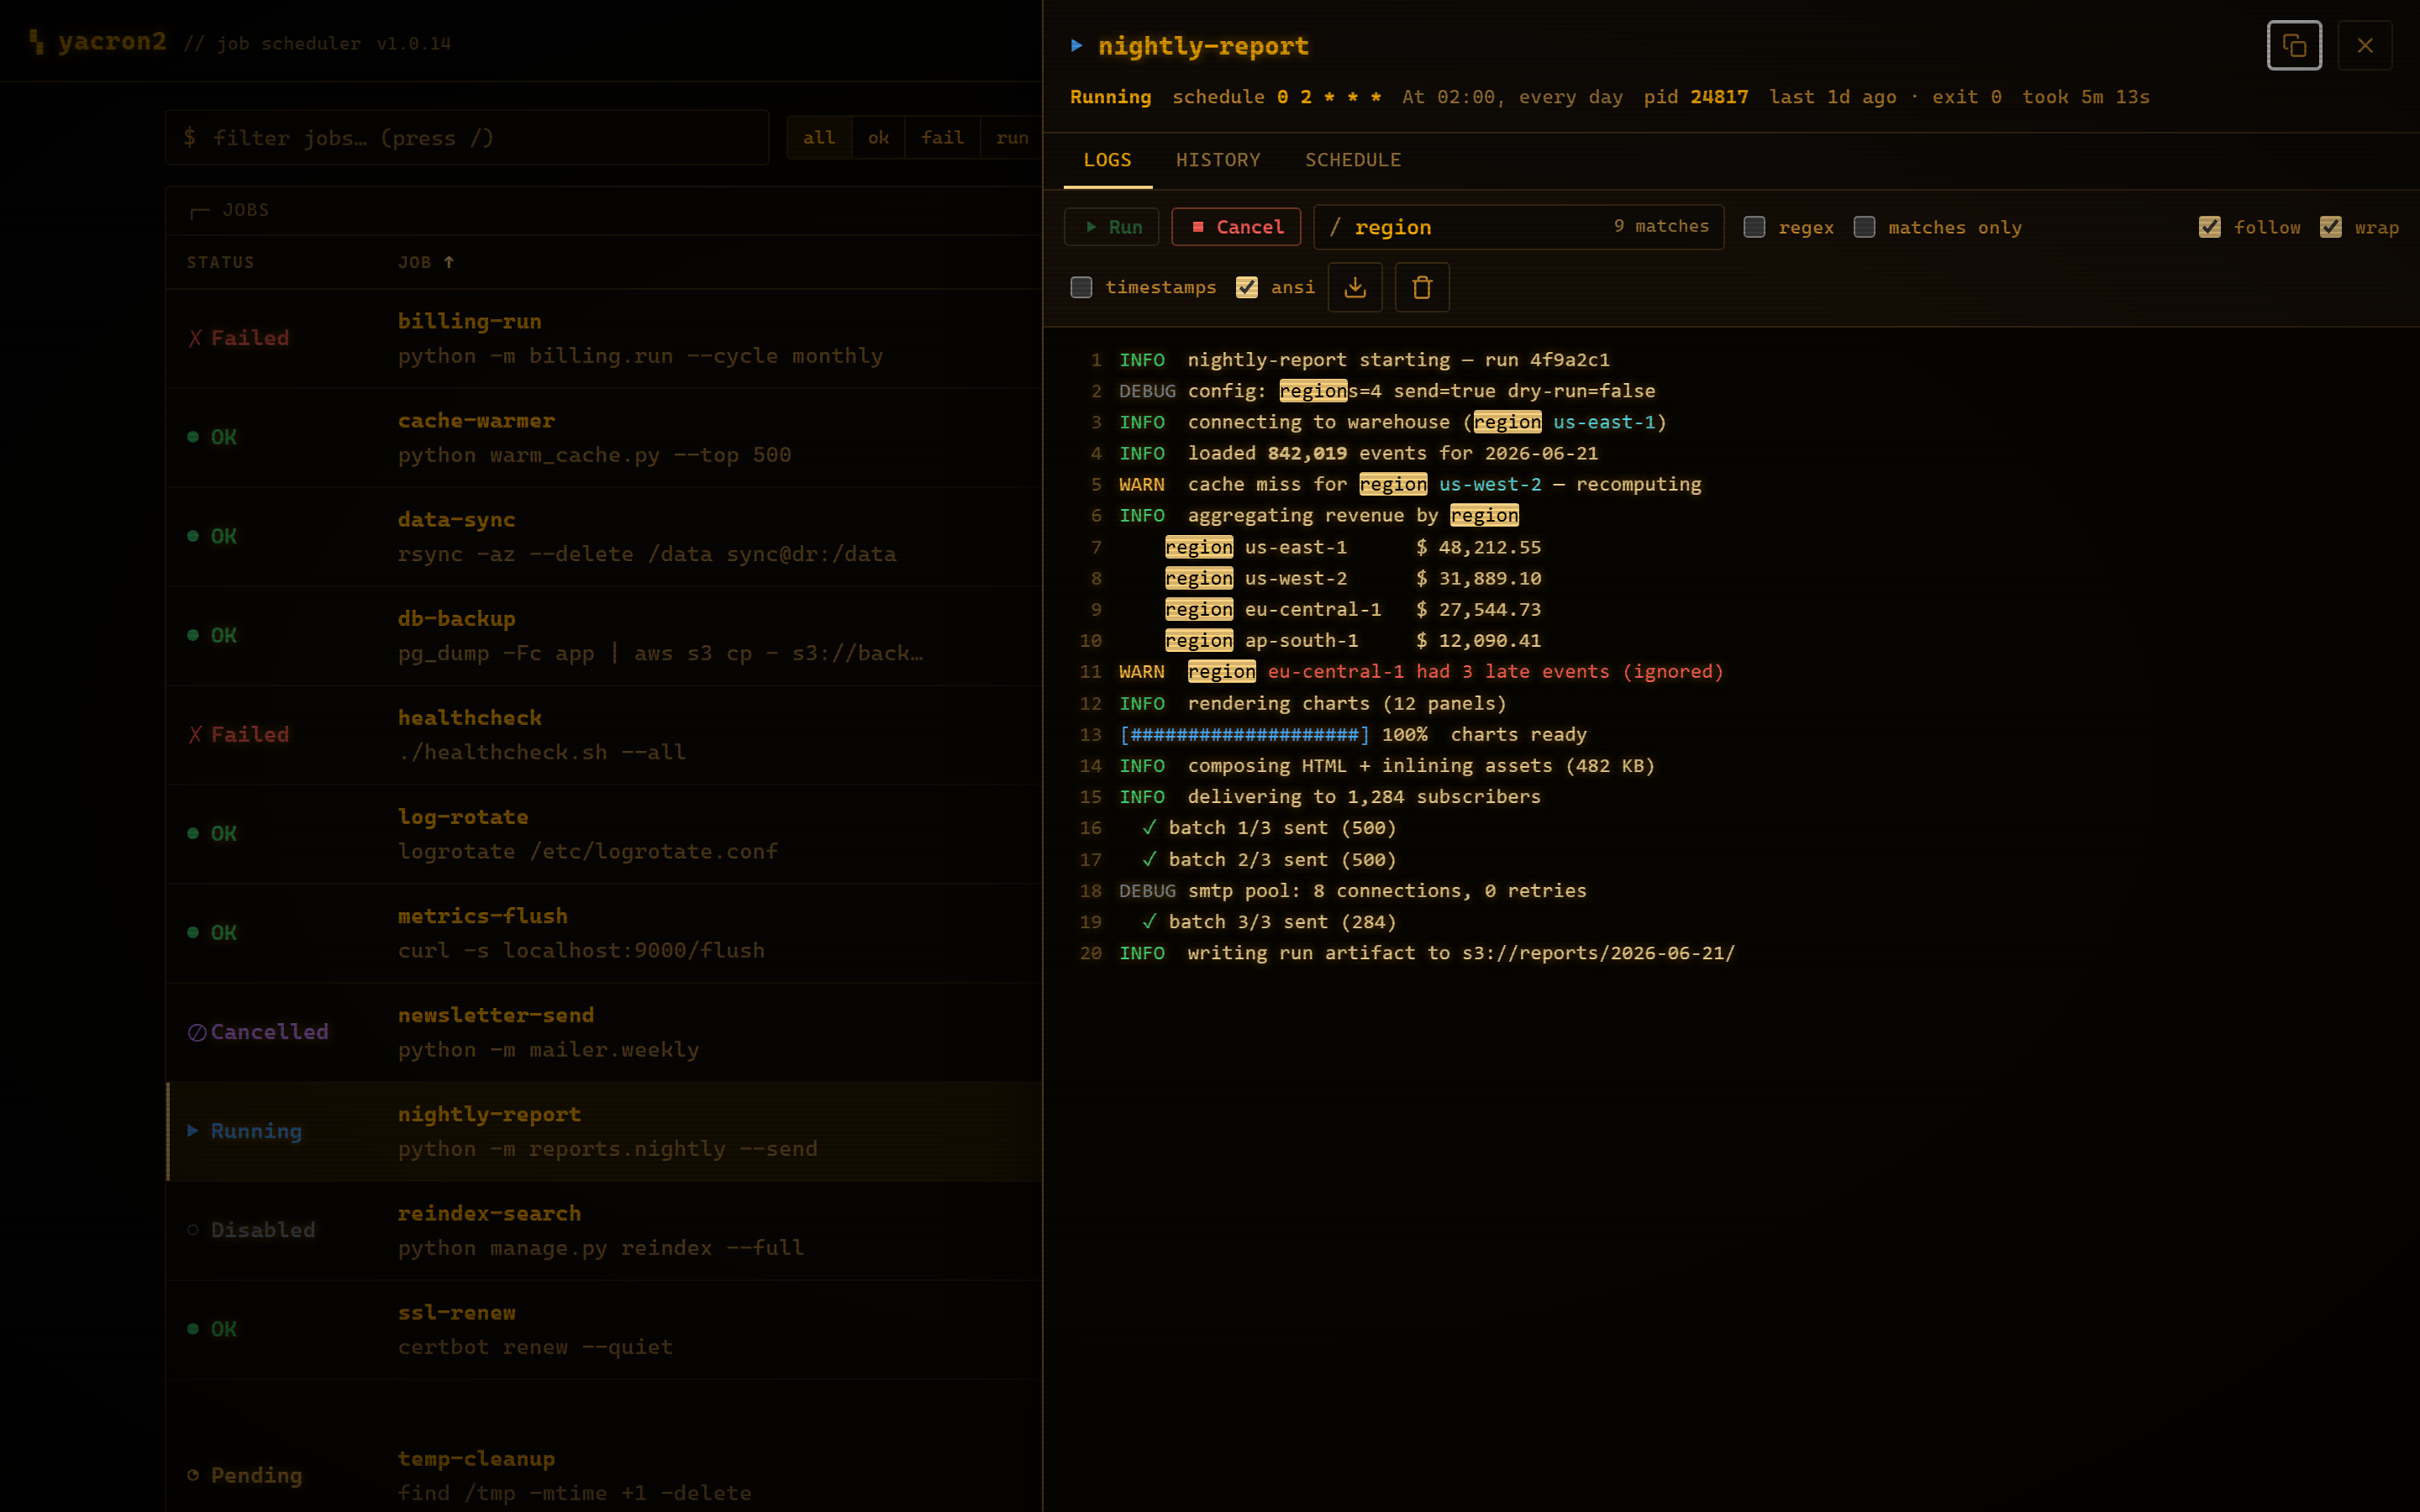
The Logs tab streams a job's captured output over Server-Sent Events: it replays the most recent buffered lines first, then appends new lines live as a running job produces them. Features:
-
ANSI color rendering (toggle off to see raw text), with
stderrlines distinguished fromstdout; - absolute line numbers and optional per-line timestamps;
- in-log search / grep, plain-text or regex, with a live match count,
Enterto jump between matches, and a matches-only mode that hides non-matching lines; - follow (auto-scroll) and line-wrap toggles;
- one-click download of the buffered log, and a clear button;
- Run and Cancel buttons right above the output.
Output is only available for the streams a job captures, so enable
captureStdout / captureStderr on jobs whose output you
want to watch here. (If neither is enabled, the pane says so rather than sitting
empty.) The view is bounded to the most recent lines so a chatty job can't grow
the tab without limit.
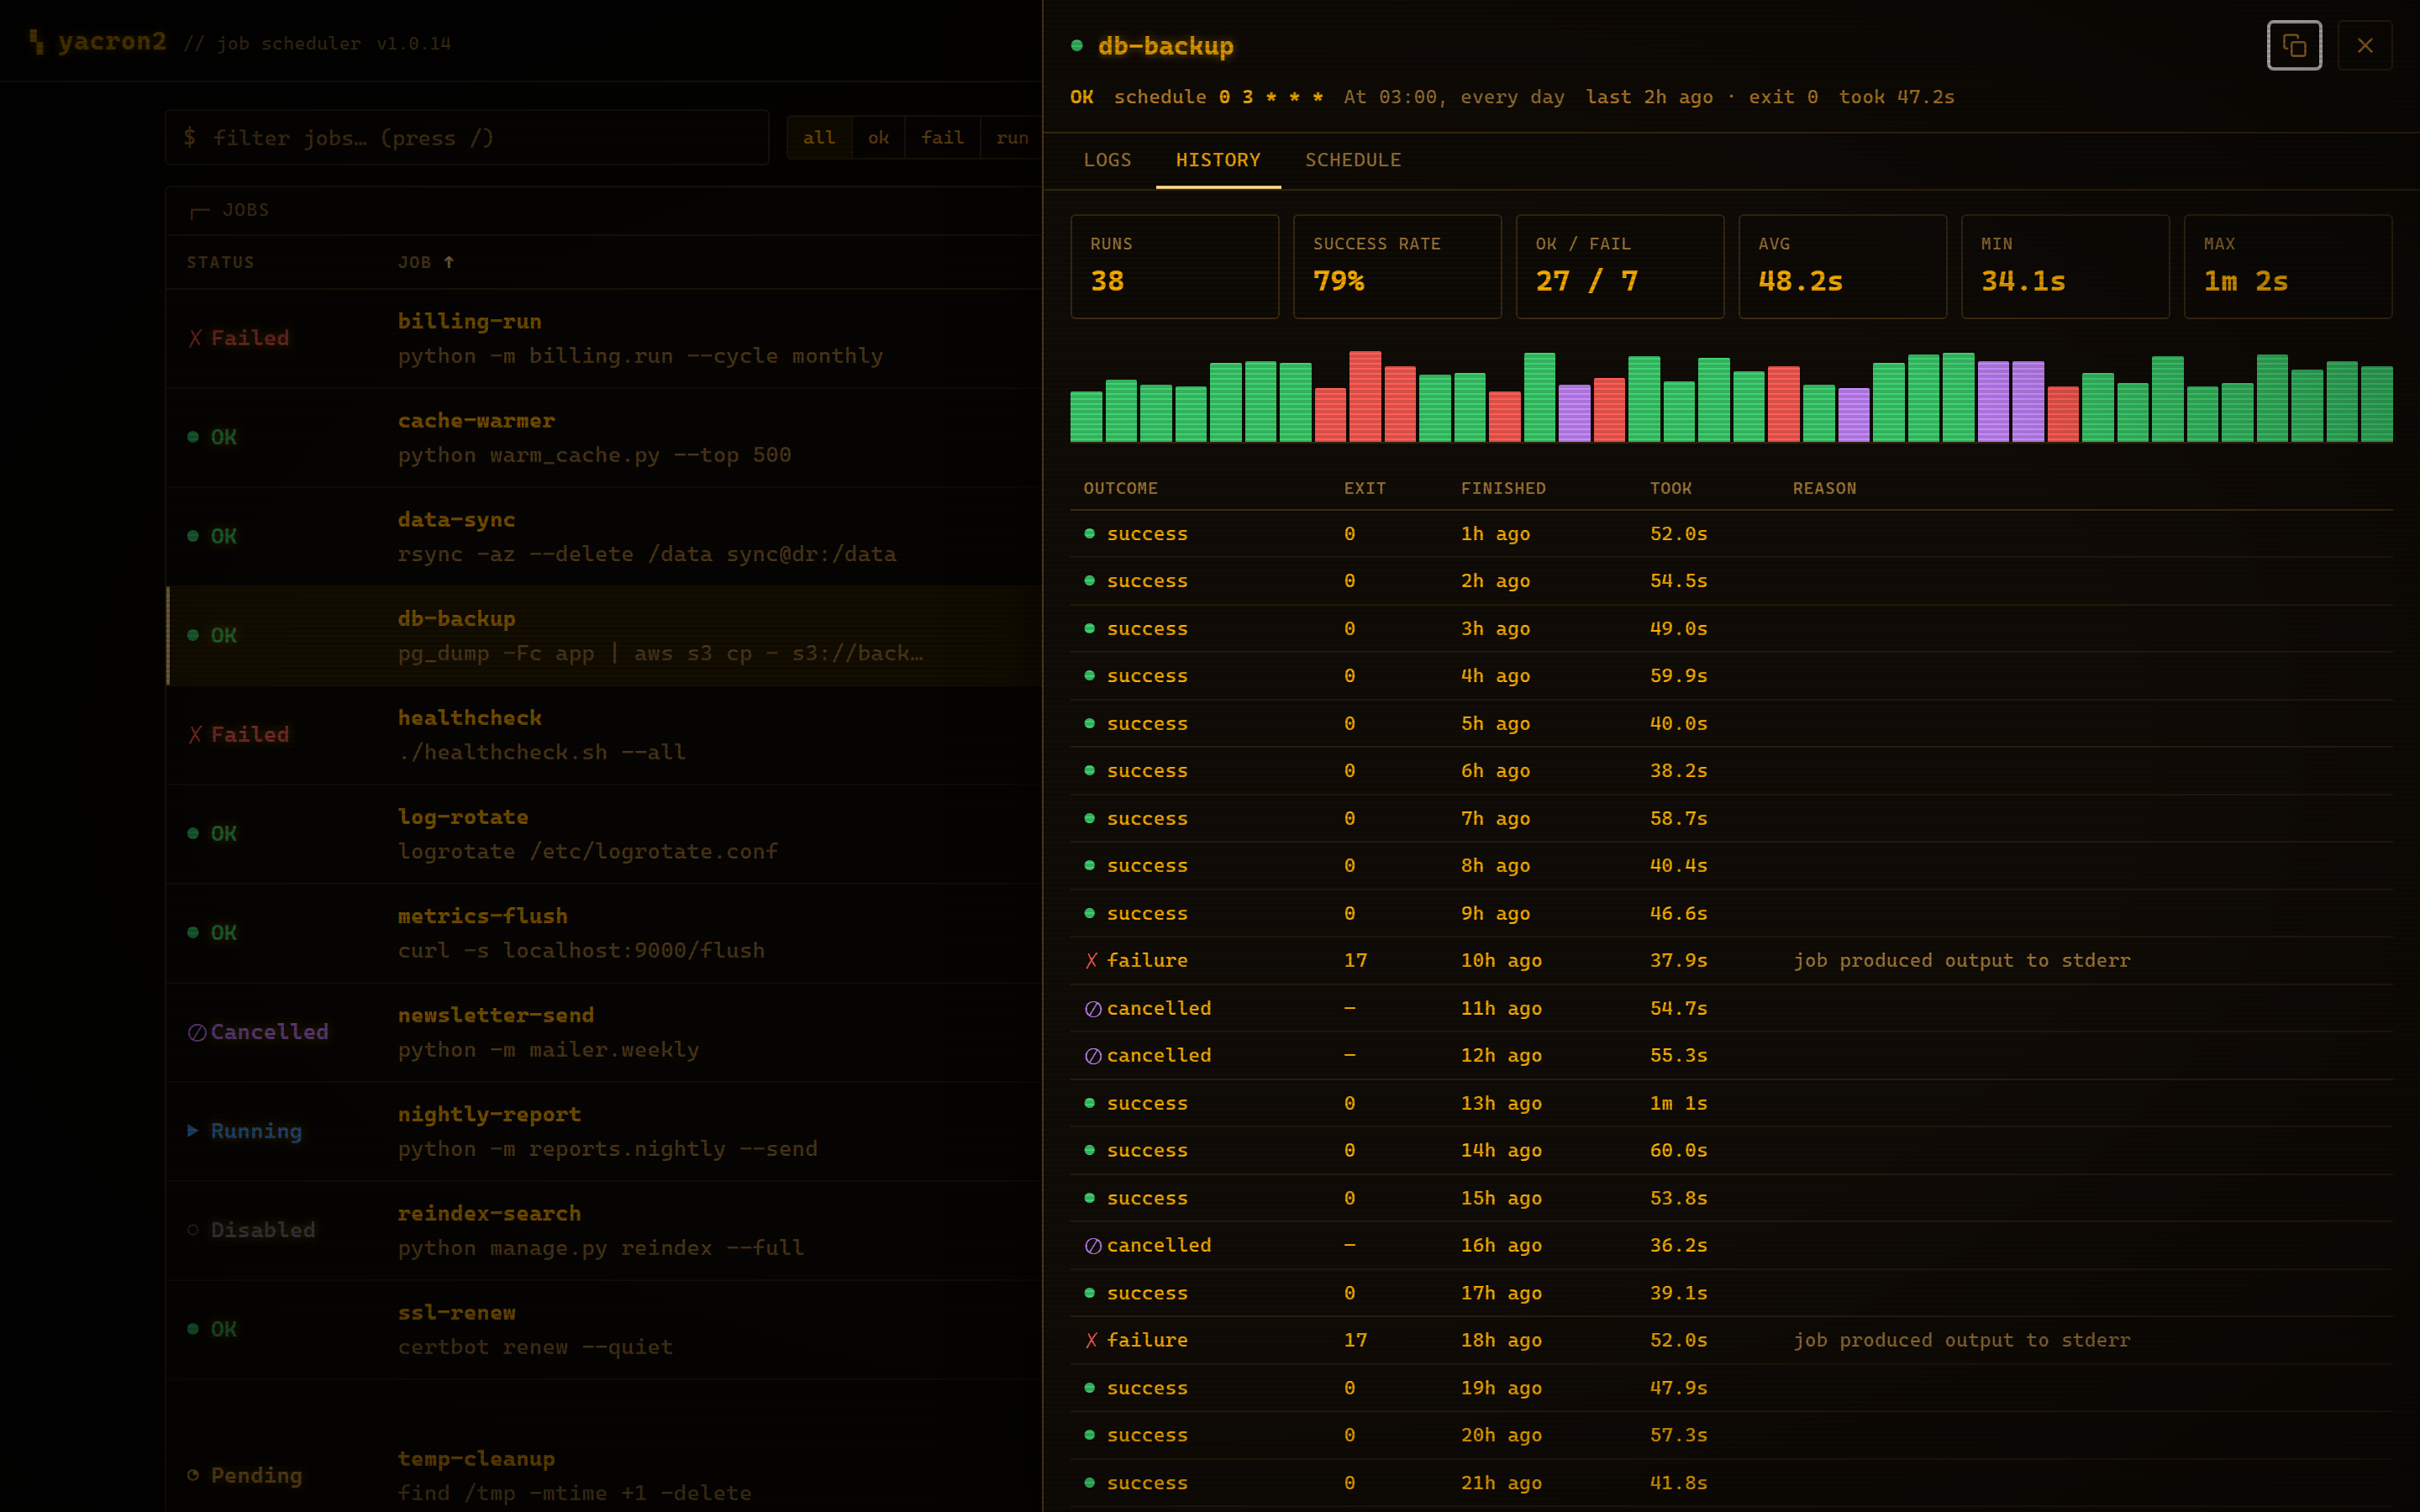
The History tab summarizes the job's retained run history:
- a stats grid: total runs, success rate, OK / fail counts, and average / min / max duration. The success rate is computed over runs that ran to completion, so deliberate cancellations are excluded;
- a duration bar chart, one bar per run (newest on the right), colored by outcome;
- a run table: outcome, exit code, when it finished, how long it took, and a reason for any run that carries one (failed runs, and runs cancelled from the dashboard).
History is retained in memory only, up to the most recent 50 runs per job, and resets when yacron2 restarts.
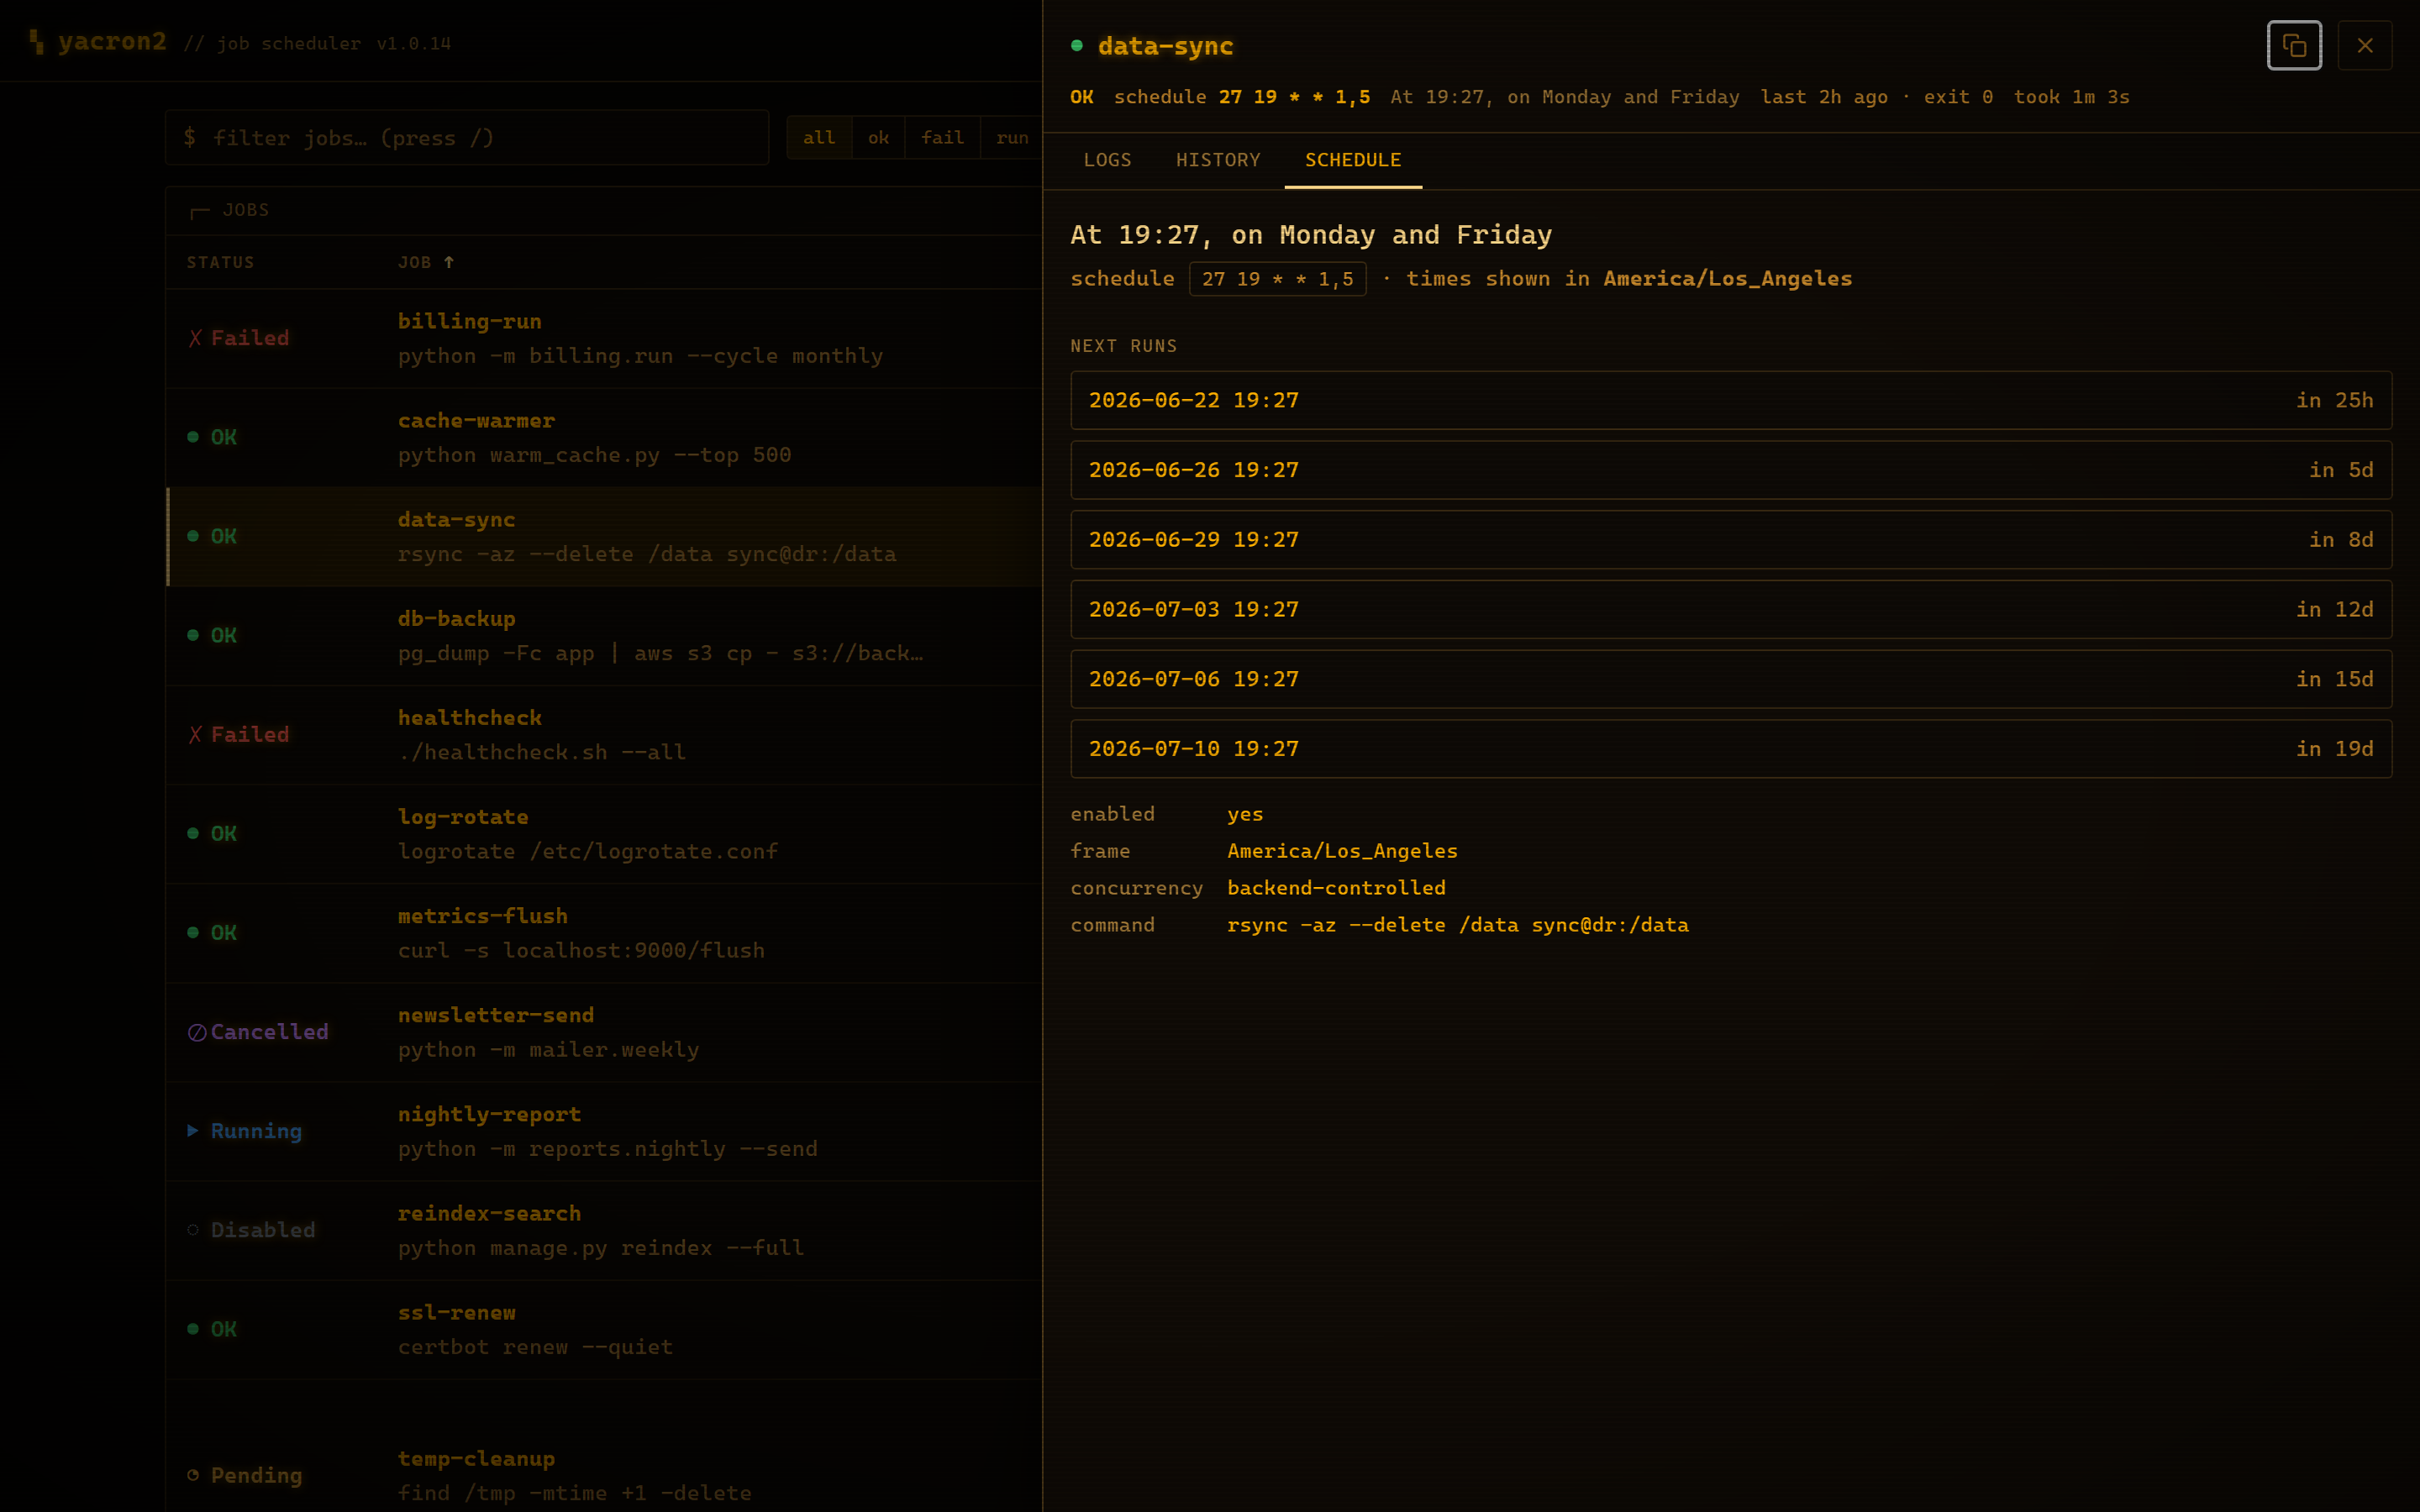
The Schedule tab turns the cron expression into something you can read at a glance:
- a plain-English description (e.g. "At 19:27, on Monday and Friday"), understanding ranges, steps, lists, names, and the
@daily/@hourly/@rebootmacros; - a preview of the next run times, computed live in the browser and shown in the job's own timezone (UTC, server-local, or an arbitrary IANA zone such as
America/Los_Angeles), each with a relative countdown; - impossible schedules (such as the 31st of February) are detected and called out rather than described as if they will fire;
- a key/value summary of whether the job is enabled, its timezone frame, a concurrency note, and its command.
When a cluster
section is configured, the dashboard shows a cluster panel below the job
table (it stays hidden otherwise). The panel polls GET /cluster alongside the
job list and renders:
Try it: the bundled Compose demos bring the dashboard up with one command.
docker-compose-cluster.ymlstarts the three-node gossip cluster (yacron-a/yacron-b/yacron-c) so you can watch the peer table, roles, and leadership move live; stop a node to see the summary and dots react. For the ambient wallboard view (including the "zen" all-clear screensaver),docker-compose-zen.ymlruns a single deliberately calm node.
- a summary line with this node's name (e.g.
yacron-a) and the agreement tally (e.g.yacron-a · 2/2 agreed); when leader election is on, it also shows the live quorum count and this node's role: leader, follower (with the current leader's name), or no quorum when the node has stood down. Underdistribution: spreadthere is no single leader, so the role reads spread (per-job owner) while quorate, or spread (no quorum) otherwise. Under spread the summary also reports how many jobs this node owns (e.g.… · owns 3). When the cluster is in conflict the role instead reads standing down (conflict), because the conflict failsLeaderjobs closed regardless of who holds the lead, and the summary appends a loud⚠ … — Leader jobs pausednote naming the cause, one of three: a duplicatenodeName(two peers advertising the same name), a cluster size mismatch (peers declaring different cluster sizes, e.g. mid-resize), or a coordination policy mismatch (a peer running a differentdistribution/elect_leader). See Clustering and Leader Election for what each conflict means and how to clear it; - a per-peer table with the on-screen headers Peer | Node | Owns
| Status | Job set, listing each peer's address, reported node name,
status, and the short form of its job-set id, with a coloured status dot:
green for
agreed, amber forsyncing, red fordrifted/untrusted/conflict, grey forunreachable, blue forself, and a faint-grey dot for a peer that isunknown(configured but not yet contacted, so no status has come back). The Owns column (counting how many jobs each node owns) is present only underdistribution: spread, so the whole job-to-node distribution is visible at a glance (it pairs with the per-job Owner column in the job table above); outside spread it reads—.
Peers the node has listed as its own address (self) are excluded from the
agreement tally. This makes it easy to watch a rolling deploy (syncing →
agreed), spot drift, or watch leadership move when a node goes down.
A ▚ timeline button in the panel header toggles a per-peer swimlane: a
lane per peer, coloured by status over time, that accumulates in the browser
while the tab is open (so you can see a syncing → agreed convergence or a
flapping peer as a stripe rather than a single instant). It charts the gossip
peer set only, so it is hidden entirely for the lease backends.
The dashboard normally shows one node's truth: /jobs reports the runs this
node made, so under
distribution: spread
a job that last ran on a peer shows nothing here. The ⊞ fleet button in
the cluster panel header opens the fleet view, a jobs × nodes matrix that
closes that gap: one row per job (the union of every node's advertised jobs,
so a mid-deploy peer's new job shows up too), one column per node, each cell
that node's state for the job: ▶ running, the last outcome with its age
(● ok 3m, ✗ failure 12s), ◌ off for disabled-there, ◔ for never ran
there, — for not configured there, and · when the node has reported no
data at all. Hovering a cell reveals the exit code, finish time, duration, and
next fire; clicking a job name opens its drawer. A failing only filter
collapses the matrix to the rows that are red anywhere in the fleet, and under
spread the cell belonging to each job's current owner carries an accent
marker, so "who should run this next" and "who ran it last" sit side by
side.
The data arrives by piggyback, not fan-out: every node attaches a compact
per-job summary (running / enabled / next fire / last run) to the mutual-TLS
/peer response it
already serves, so each node absorbs the whole fleet's state through the peer
polls it already makes, and the dashboard reads the merged result from
GET /fleet on its usual poll: no extra traffic
towards the peers, and any node can serve the single pane of glass. The cost
of that design is freshness: a peer column is up to one gossip interval
stale (30 s by default), so every column header shows its node's status dot
and data age (live for the serving node, 41s ago for a peer). A briefly
unreachable peer keeps its last-known cells with a growing age instead of
going blank, and a node whose job set exceeds the gossip payload cap (512
jobs) is flagged partial. Summaries are observability data only (they
never influence election or run decisions), and like the swimlane, the view
is gossip-only: lease backends carry no summaries, so the button is hidden
there.
Separately from the in-panel summary, a cluster incident also raises the
page-level CLUSTER ALERT bar at the top of the dashboard: a red incident
banner shown whenever this node reports a cluster conflict (duplicate nodeName,
size mismatch, or coordination policy mismatch) or has lost quorum, so the
alert is visible without scrolling down to the panel. It names the cause and,
under a lease backend, phrases quorum loss as the lease store being unreachable.
The bullets above describe the gossip backend. The
lease backends
(kubernetes / etcd) have no peer set, so the panel renders a different shape:
a role summary (node-name · backend · role, where the role is leader,
follower (leader: …), follower, or no quorum (store unreachable))
followed by a key/value lease-detail table: no status dots, no agreement
tally, no quorum count. The table renders every non-null key the backend reports,
so beyond the lease/election name, the holder, the identity, and the expiry it
also surfaces the kubernetes namespace or the etcd leaseId when present. There
no quorum means the lease store is unreachable from this node, not "no
majority". See
Clustering and Leader Election
for the full GET /cluster field semantics.
The ≋ tail toolbar button opens the multi-tail console: several jobs'
log streams merged into one live pane, each line prefixed with its job name in
a stable identity colour, like tailing a set of pods. It is built for
correlated incidents: the incident verdict bar and the mitigate console each
carry a ≋ tail button that opens it pre-loaded with the failing set, and the
command palette offers a per-job Tail: … action plus failing /
running presets.
- Add jobs with the + failing / + running presets or the add box (which autocompletes to the configured jobs); remove one from its chip. Clicking a chip or a line's job prefix jumps to that job's drawer.
- The console holds at most 4 concurrent streams. Browsers allow only ~6 HTTP/1.1 connections per origin and every tailed job keeps one open, so the cap leaves the dashboard's own polling room to breathe.
- The daemon closes a job's log stream when the tailed run's output ends, so
the console re-attaches automatically for the job's next run (paced by
the refresh interval). Attaching replays the run's buffered output from the
start, so a re-attach that lands mid-run still shows the whole run, and runs
are delimited with an
── end of run output ──marker. - The view offers follow, wrap, and timestamps toggles (shared
with the drawer's Logs tab), a plain-text search with a live match
count, one-click download of the merged view (lines prefixed
[job]), and a clear button. - As with the drawer's Logs tab, output
appears only for the streams a job captures
(
captureStdout/captureStderr).
None of these need a cluster; they all work on a single node.
When something is failing, a verdict bar appears at the top of the page and
distills the situation into one line. A single failure reads
JOB FAILING — <name> · exit <code> · <reason>. When several jobs are failing,
a correlation pass groups them by exit code and failure reason and headlines
either FLEET EVENT — N jobs failing, K share exit=… — likely one cause or
"likely independent", so the first thing you read is whether this is one
incident or many. A cluster quorum, leadership, or conflict problem escalates
the bar to the red CLUSTER ALERT severity described
above. The bar carries ▤ timeline, ▸ mitigate, and
≋ tail buttons scoped to the incident set.
The incident timeline (press i, or Incident timeline in the command
palette) lists every job's most recent finished run, newest first, each with
its relative time, outcome glyph, failure reason, exit code, and duration. A
failing only filter narrows it, and the correlated blast-radius set from
the verdict bar is highlighted, so you can read "what happened, in what order"
at a glance.
The mitigate console (Mitigate failing jobs in the palette, or the
verdict bar's ▸ mitigate button) acts on the failing set in bulk: guarded
start all / cancel all actions fire the per-job
start/cancel endpoints staggered a few hundred
milliseconds apart (gentle on the daemon), abortable mid-run, with a live
per-job ✓/✗ result log and a final tally. It can also open a
multi-tail of the set, and copy a ready-made Markdown
incident summary (timestamp, host, version, cluster state, and a per-job
table) for your incident channel or ticket.
Press w (or Wallboard / TV mode in the palette, or open the page with a
#tv hash) for a full-screen kiosk view built for a wall monitor: every job as
a large tile, sorted worst-first (failing, then running, then the rest), each
with its status glyph, next-fire countdown, and sparkline, plus a footer tally
and a live UTC clock. Clicking a tile exits to that job's drawer; Esc or w
exits.
Because the normal header (and its connection indicator) is hidden, the
wallboard judges its own freshness: if no successful poll lands for ~15 seconds
(or three refresh intervals), the grid dims behind a loud ▚ NO SIGNAL /
▚ STALE DATA banner, so a wedged screen reads as broken rather than as a
frozen healthy frame.
When everything is healthy and the wallboard has been idle for a while (30
seconds by default; configurable in Settings), the zen screensaver drifts
in: an ALL SYSTEMS NOMINAL field where every enabled job is a small dot that
pulses as its real next-fire instant arrives, with a subtitle counting the jobs
armed and naming the next one due. Any input wakes it. It deliberately refuses
to show the all-green field on stale data (an unverified all-clear is NO SIGNAL, not nominal) and respects prefers-reduced-motion. The
docker-compose-zen.yml demo boots a single calm node to show it off.
The ▦ heat header button (or Toggle activity heatmap in the palette)
adds a punchcard card: one row per job, 24 time buckets across a 6h / 24h /
7d window, each cell colored by the worst outcome in that bucket and shaded
by run volume. Hover a cell for the bucket's tally (e.g. 3 ok / 1 fail);
click a cell or a job name to open that job. It is built by fetching each
job's run history (capped and cached in the
browser), so its horizon is bounded by the daemon's in-memory history.
Cron sandbox in the palette opens a scratchpad for schedule expressions: type
any 5-, 6-, or 7-field cron expression (including second-level
schedules) or @macro, pick a timezone frame, and it validates the expression,
describes it in plain English, breaks out the fields, and previews the
next 12 fire times with wall-clock and relative labels (impossible
schedules and @reboot are called out). It cross-references
your live jobs to show which ones use the same schedule, and keeps a
browser-local list of recent expressions. The same engine powers the
dashboard's schedule advisories (overlap, thundering-herd, and DST warnings).
The daemon keeps at most the last 50 runs per job in memory. The opt-in run
ledger (a Settings toggle, or Toggle run ledger in the palette) extends
that horizon in your browser: while a tab is open it records each newly
finished run into IndexedDB, computes robust per-job duration baselines
(median plus deviation over successful runs), and flags runs that are
unusually slow with a ◱ slow chip on the job row. Settings shows the storage
used, with one-click export (a JSON dump) and purge. The ledger lives
only in that browser: it grows only while a tab is open, and it never sends
anything back to the daemon.
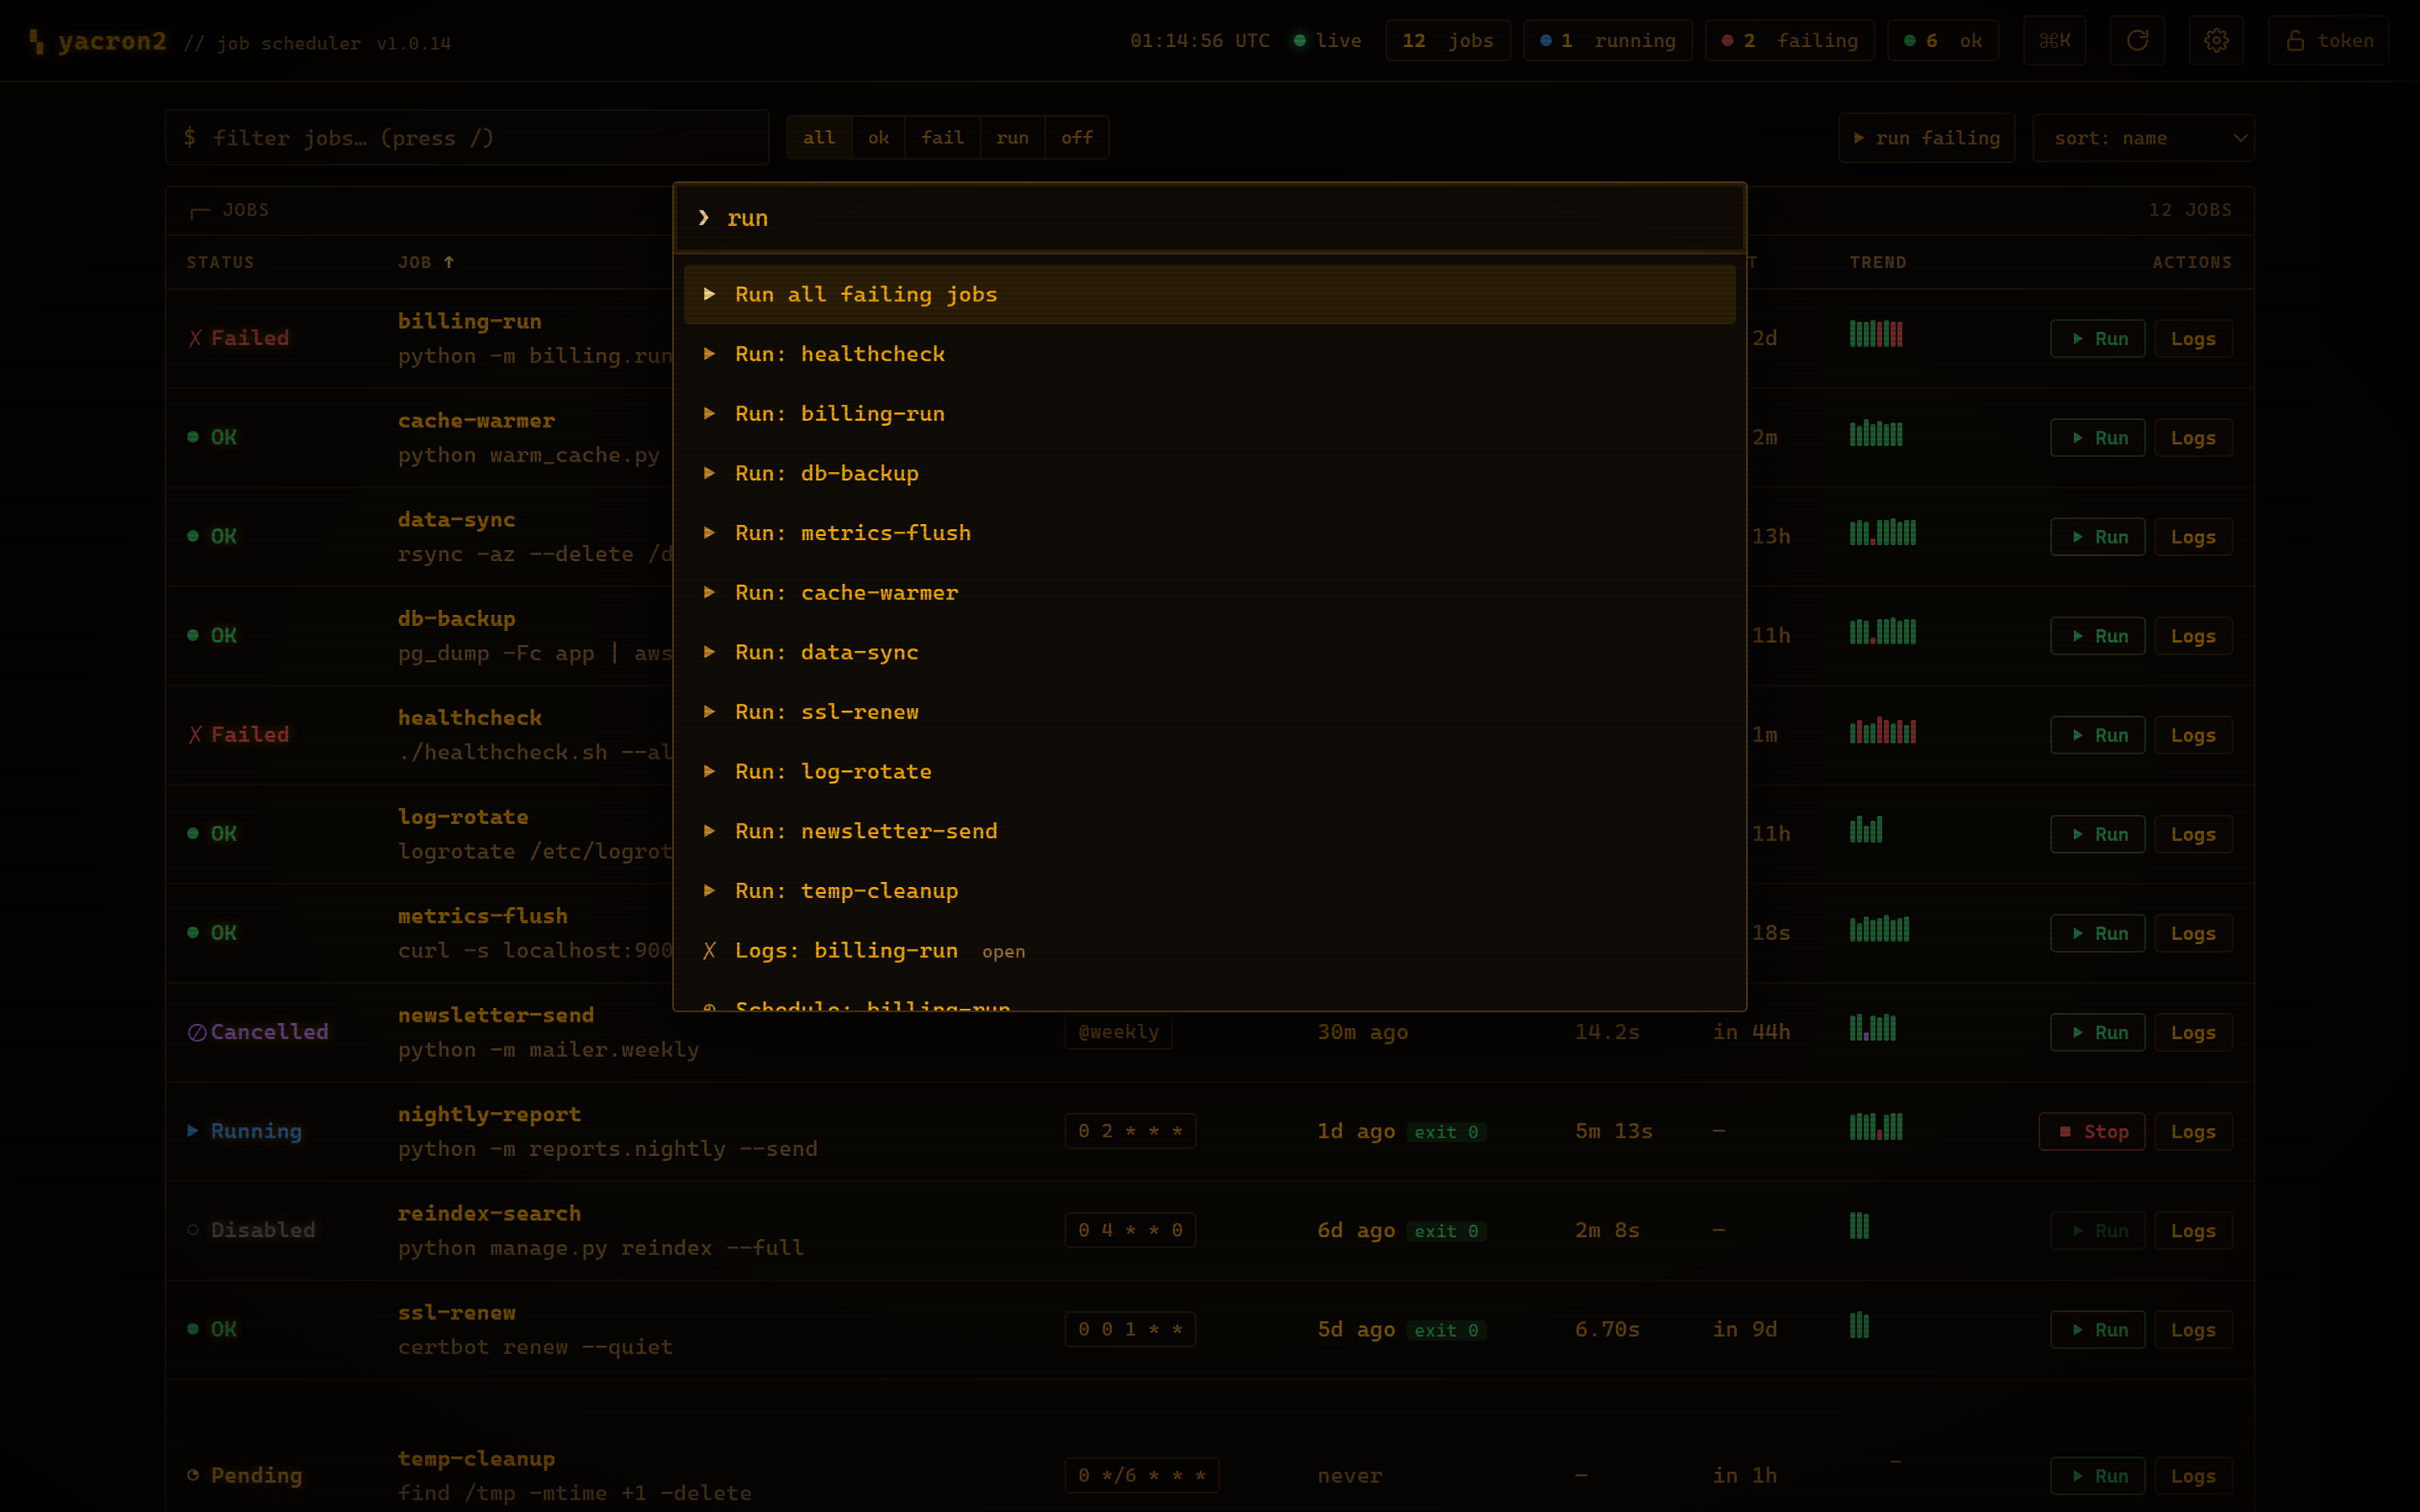
Press Ctrl-K (or ⌘K, or Ctrl-P) to open a fuzzy command palette. It
searches both global actions (refresh, run all failing jobs, cycle theme, toggle
effects, open settings, set the access token…) and a per-job action for every job
(open its logs, run it, cancel it, copy its command, view its schedule). Type to
filter, arrow keys to move, Enter to run.
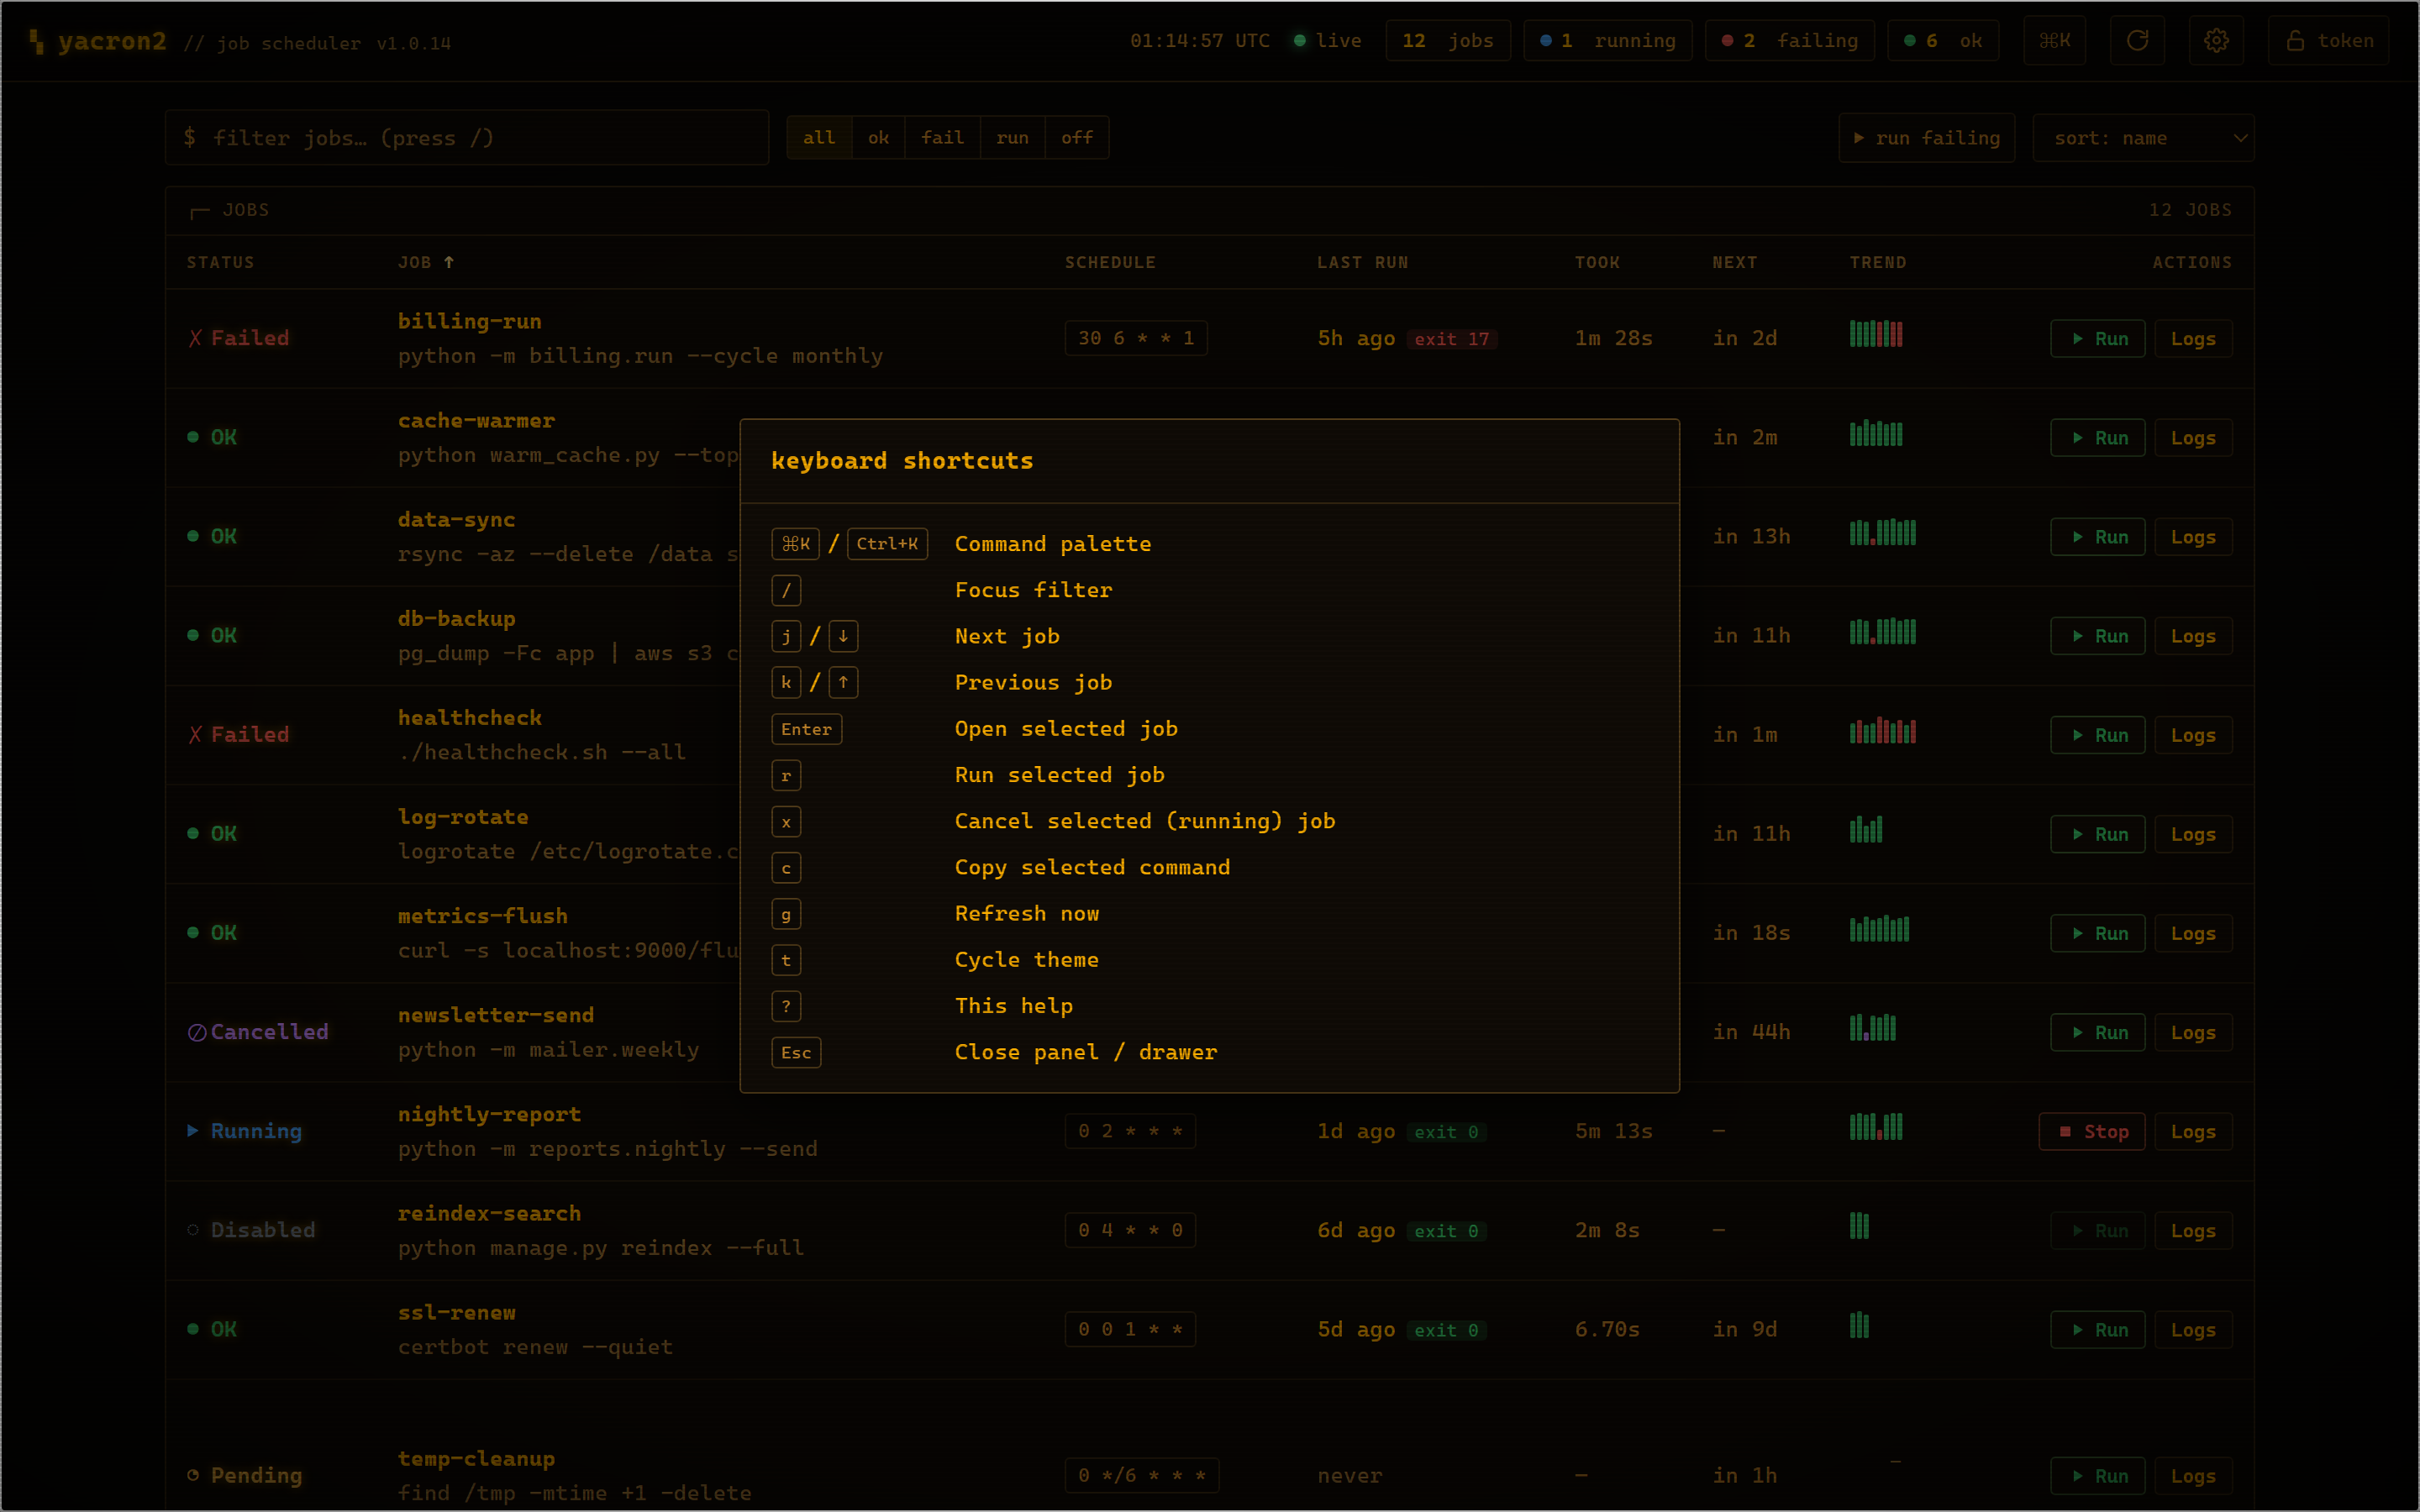
The dashboard is keyboard-first. Press ? at any time for this overlay.
| Key | Action |
|---|---|
Ctrl-K / ⌘K
|
Open the command palette |
/ |
Focus the filter box |
j / ↓
|
Select the next job |
k / ↑
|
Select the previous job |
Enter |
Open the selected job |
r |
Run the selected job |
x |
Cancel the selected (running) job |
c |
Copy the selected job's command |
g |
Refresh now |
t |
Cycle the theme |
w |
Toggle the wallboard / TV mode |
i |
Open the incident timeline |
? |
Show the shortcut list |
Esc |
Close the open panel or drawer |
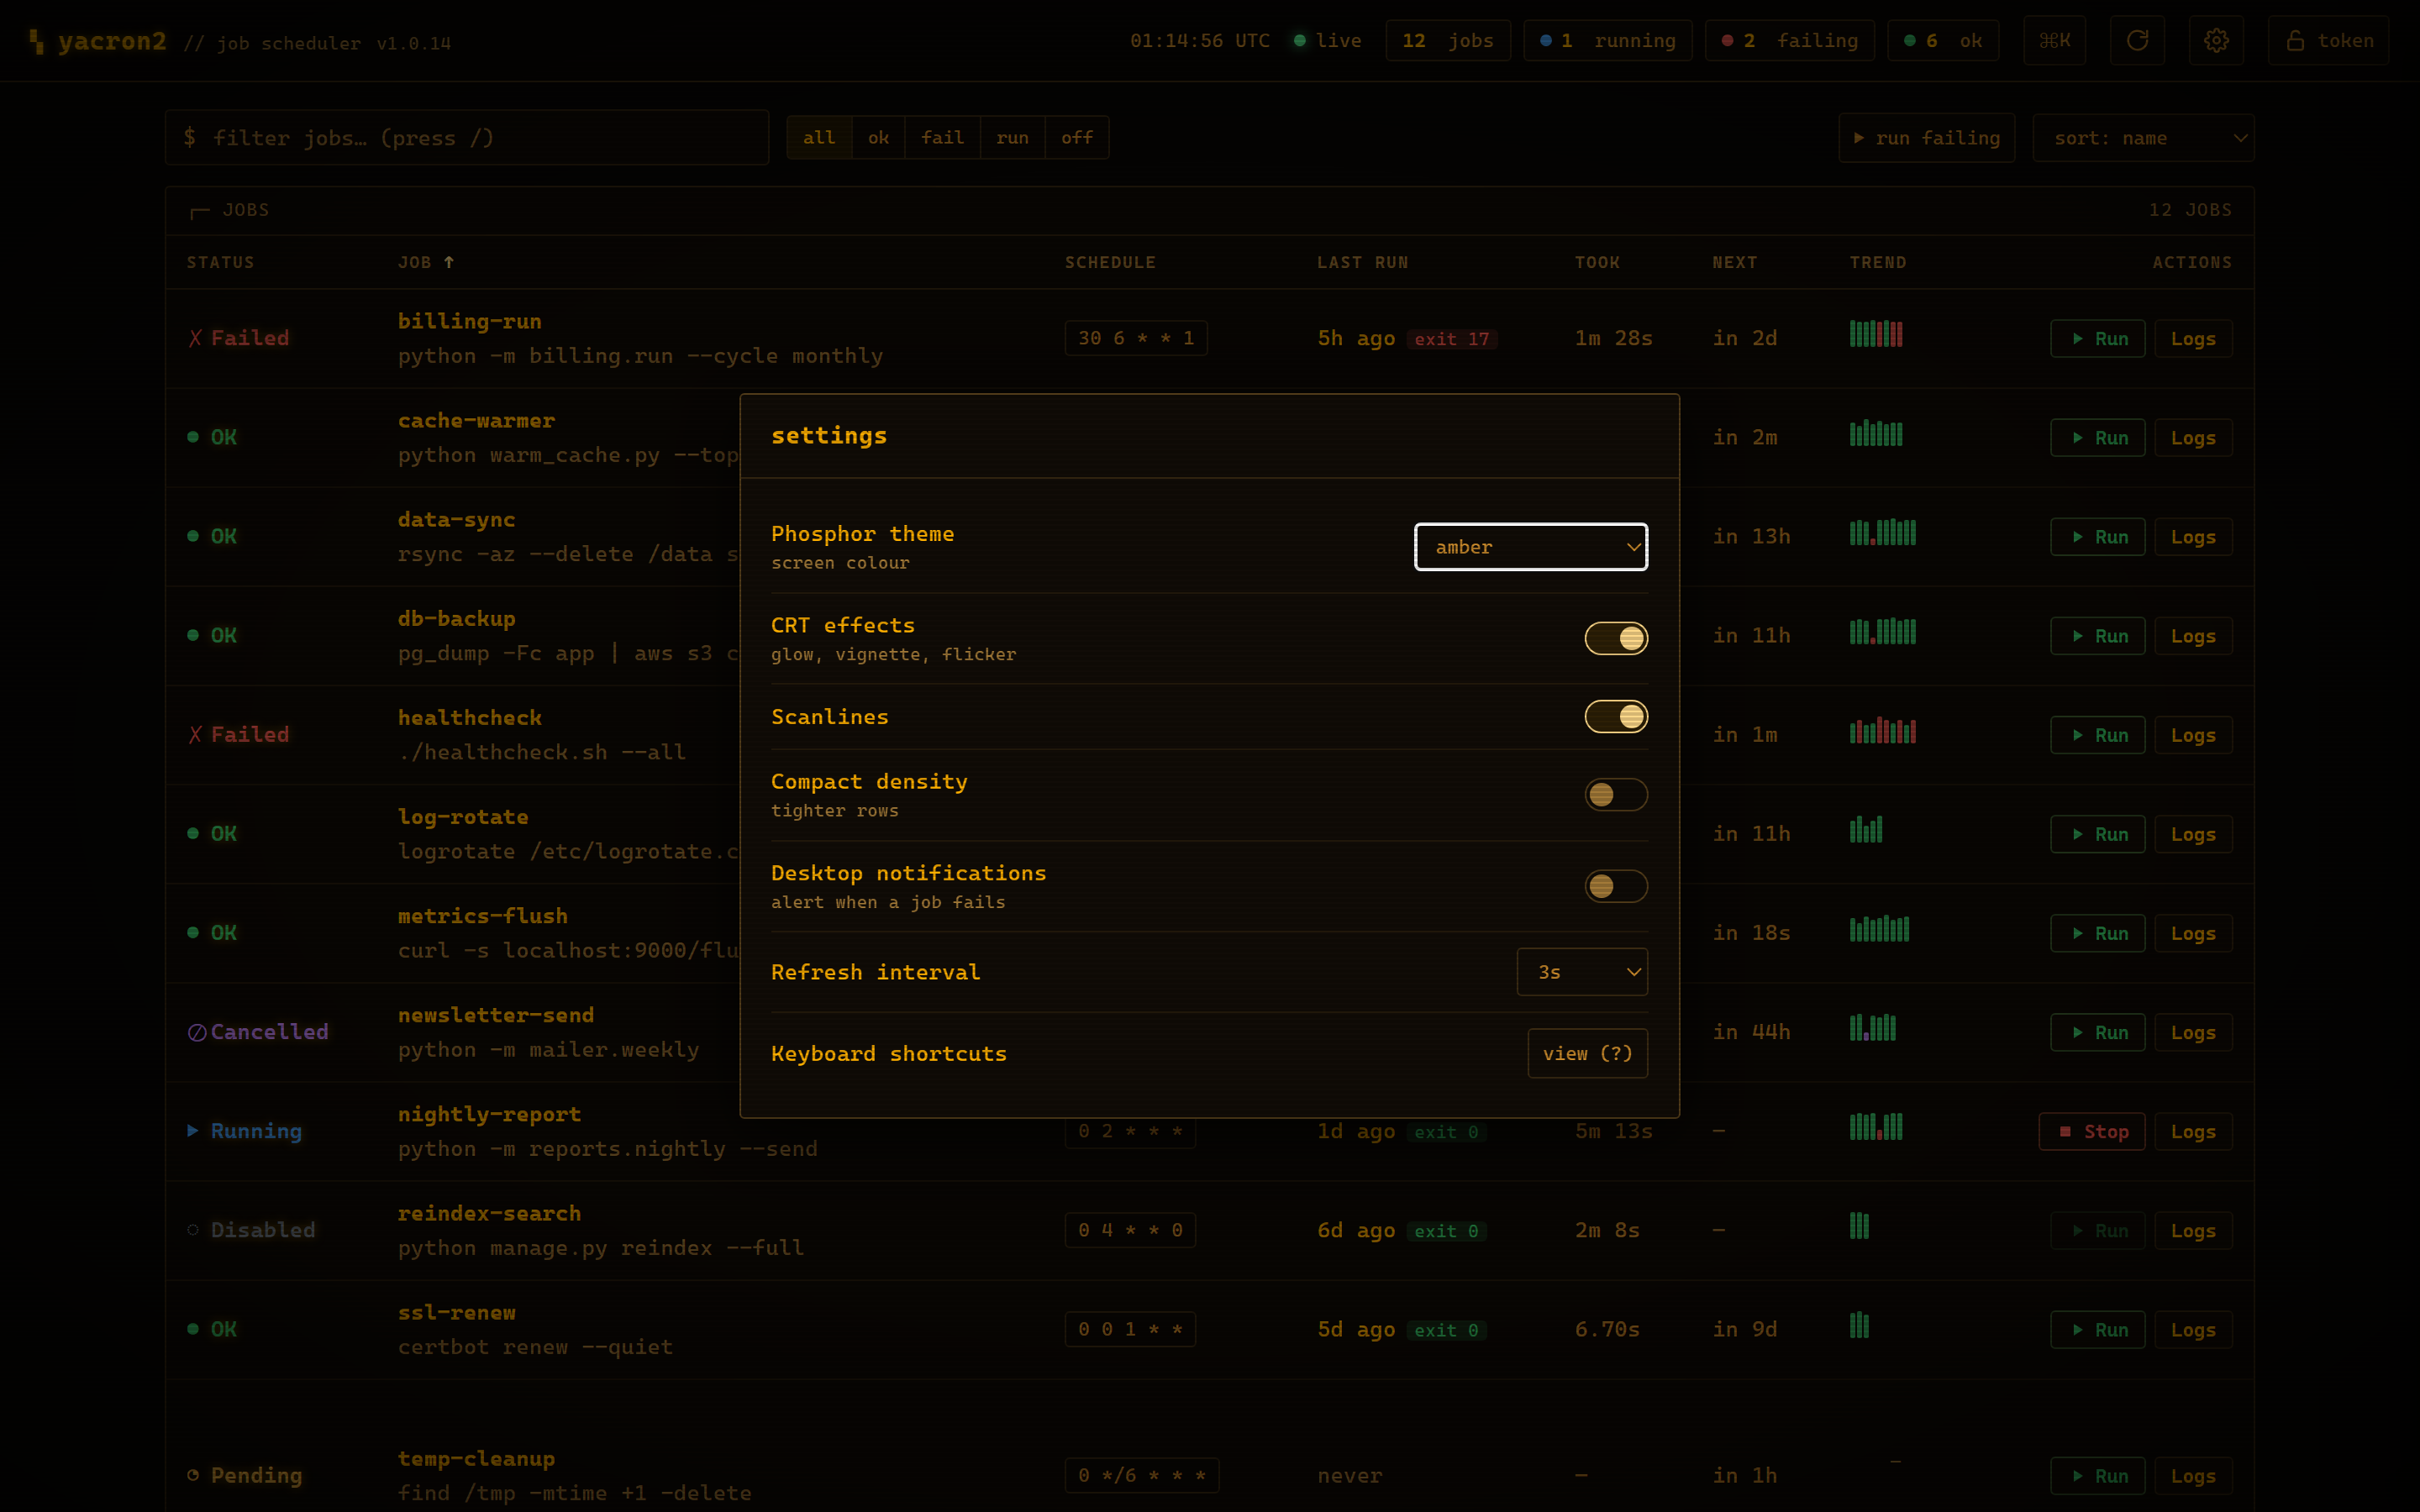
The settings panel (and the command palette) expose:
-
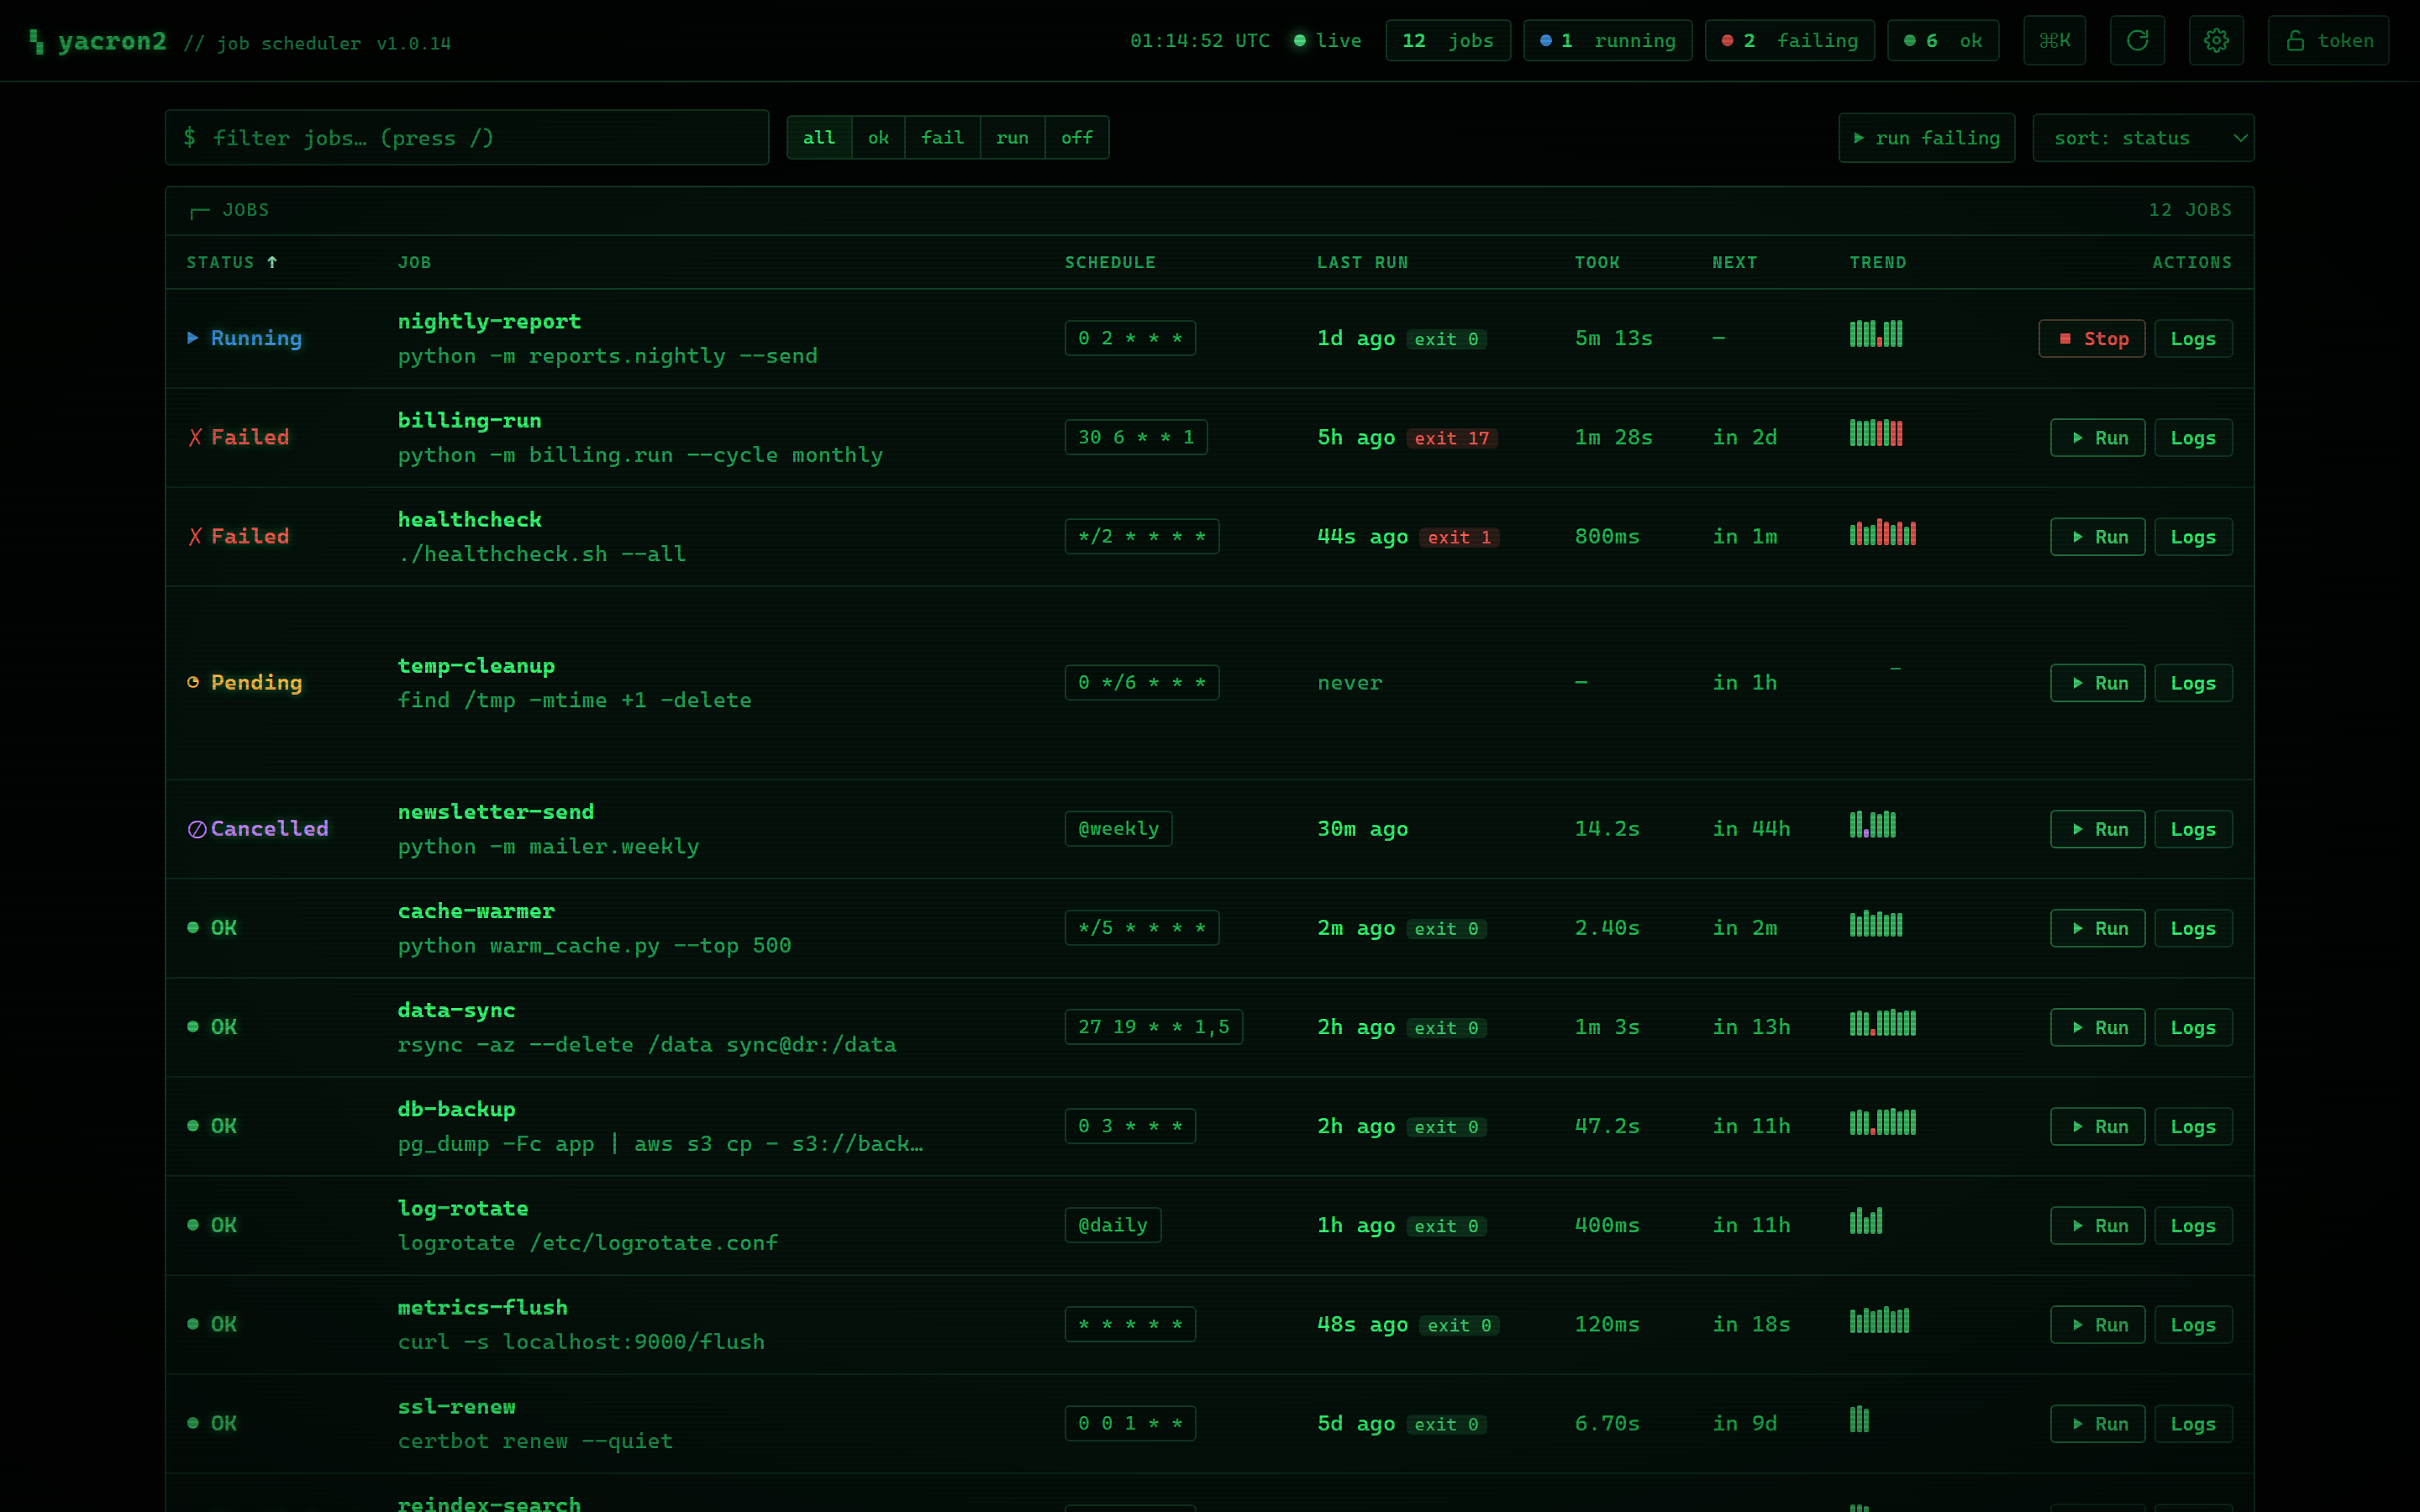
Three themes: amber and green phosphor CRT, or a flat modern theme. Cycle them with
t. -
CRT effects (phosphor glow, vignette, and a subtle flicker) and scanlines, each toggleable. They apply only to the CRT themes and automatically respect
prefers-reduced-motion. - Compact density for tighter rows.
- Desktop notifications that fire when a job fails (after you grant the browser permission).
- A refresh interval of 1s / 2s / 3s / 5s / 10s, or paused.
- The zen screensaver toggle and its idle delay, for the wallboard.
- The opt-in run ledger, with its storage stats, export, and purge buttons.
All preferences are remembered in the browser's localStorage, so the dashboard
comes back the way you left it.
| Green phosphor CRT | Flat modern theme |
|---|---|
 |
 |
When bearer-token authentication is enabled
(web.authToken), the dashboard page itself loads without a token: it
carries no data and no secrets. The first data request returns 401, and the
dashboard then prompts you for the token, stores it only in that browser tab
(sessionStorage), and attaches it as Authorization: Bearer … on every
subsequent request. You can update or clear the stored token from the header's
token button at any time.
The dashboard is a thin client over the HTTP Control API:
- it polls
GET /jobson the refresh interval for the overview (each job carries a compact tail of recent runs for the sparkline); - it polls
GET /clusteron the same interval for the cluster panel (the panel stays hidden unless a cluster section is configured); - while the fleet view is open,
GET /fleetrides the same poll (the daemon answers it from gossip state it already holds); - opening a job's History tab fetches
GET /jobs/{name}/runs(full retained history plus aggregate stats); the activity heatmap batches the same endpoint across jobs (capped, with a short-lived cache); - opening the Logs tab opens the
GET /jobs/{name}/logsSSE stream; - the multi-tail console opens up to four of those SSE streams at once (one per tailed job) and re-attaches them as runs come and go;
- the Run / Stop buttons call
POST /jobs/{name}/startandPOST /jobs/{name}/cancel; - the version in the header comes from
GET /version.
All run history and captured output lives in memory in the running daemon (the most recent 50 runs per job) and is never written to disk, so the dashboard adds nothing to yacron2's read-only-root-filesystem deployment story and resets cleanly on restart.
- HTTP Control API: the REST endpoints, configuration schema, authentication, and Unix-socket options the dashboard is built on.
-
Clustering and Leader Election: the cluster panel, per-job
clusterPolicy, and theGET /clusterview it polls. -
Output Capturing:
captureStdout/captureStderr, which control what the Logs tab can show. - Schedules and Timezones: the schedule strings and timezones the Schedule tab explains and previews.
- Production and Container Deployment: running the interface under a hardened, read-only-root-filesystem deployment.