stepMode automatically draws left and right vertical lines #2021
Description
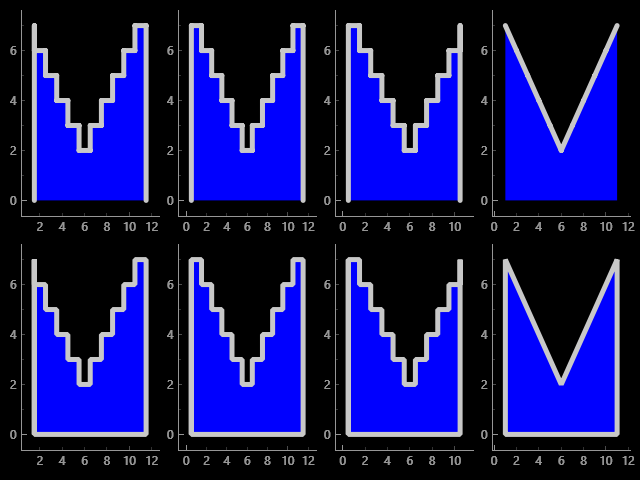
Just to document some inconsistencies in PlotCurveItem stepMode.
In stepMode, the vertical lines at the left and right edges are automatically added when fillLevel is active, differently from non-stepMode.
The code that does this is in PlotCurveItem::_generateStepModeData(). It has some overlap with what fillOutline=True does.
Top row is fillOutline=False
Bottom row is fillOutline=True
import pyqtgraph as pg
import numpy as np

yc = [7, 6, 5, 4, 3, 2, 3, 4, 5, 6, 7]
xc = np.arange(1, len(yc)+1)
xl = xc + 0.5
xr = xc - 0.5
xlr = np.arange(1, len(yc)+2) - 0.5

pg.mkQApp()
win = pg.GraphicsLayoutWidget(show=True)
plt1 = win.addPlot()
plt2 = win.addPlot()
plt3 = win.addPlot()
plt4 = win.addPlot()
win.nextRow()
plt5 = win.addPlot()
plt6 = win.addPlot()
plt7 = win.addPlot()
plt8 = win.addPlot()

pen = pg.mkPen(width=5)

fillopts = dict(pen=pen, fillLevel=0, fillOutline=False, brush='b')
plt1.plot(x=xl, y=yc, stepMode="left", **fillopts)
plt2.plot(x=xlr, y=yc, stepMode="center", **fillopts)
plt3.plot(x=xr, y=yc, stepMode="right", **fillopts)
plt4.plot(x=xc, y=yc, **fillopts)

fillopts = dict(pen=pen, fillLevel=0, fillOutline=True, brush='b')
plt5.plot(x=xl, y=yc, stepMode="left", **fillopts)
plt6.plot(x=xlr, y=yc, stepMode="center", **fillopts)
plt7.plot(x=xr, y=yc, stepMode="right", **fillopts)
plt8.plot(x=xc, y=yc, **fillopts)

pg.exec()