Issue 589: Add basic time profiler to contrib.handlers #729
Conversation
|
Hello @vfdev-5, I picked off from PR #604. I have two questions/problems before we can finalize this:
|
|
@ykumards thanks for the PR I start with the second question:
These events were introduced very recently, much after
Yes, idea is to provide some measures on dataflow preparation: dataflow times vs forward/backward passes times. import time
def data_iterator(data):
while True:
for d in data:
time.sleep(0.01)
yield d |
…_BATCH_COMPLETED events
|
@ykumards thanks! So, it remains a dump to CSV and we are done :) |
There was a problem hiding this comment.
@ykumards, we are almost perfect :) Just some minor things to fix.
We also need to update the documentation: https://github.com/pytorch/ignite/blob/master/docs/source/contrib/handlers.rst
You can for example add a section after "param_scheduler"
time_profilers
---------------

.. automodule:: ignite.contrib.handlers.time_profilers
   :members:
| None | ||
|
|
||
| Attributes: | ||
| data_flow_times (torch.Tensor): tile elapsed during data loading |
There was a problem hiding this comment.
| data_flow_times (torch.Tensor): tile elapsed during data loading | |
| data_flow_times (torch.Tensor): time elapsed during data loading |
|
And, for instance, let's do not pay attention to codecov/patch |
| >>> profiler.print_results(results) | ||
|
|
||
| The results would look as follows: | ||
| -------------------------------------------- |
There was a problem hiding this comment.
@ykumards I think we need to insert the output inside
    .. code-block:: text

        - Time profiling results:
        --------------------------------------------
        Processing function time stats (in seconds):
            min/index: (2.9754010029137135e-05, 0)
            max/index: (2.9754010029137135e-05, 0)
            mean: 2.9754010029137135e-05
            std: nan
            total: 2.9754010029137135e-05
| event type, processing stats and dataflow stats and may look as | ||
| follows: | ||
|
|
||
| -------------------------------------------- |
There was a problem hiding this comment.
Same here, please use
    .. code-block:: text

        --------------------------------------------
        epoch iteration processing_stats dataflow_stats Event_STARTED ...
|
@ykumards minor fixes still needed i think. You can check documentation rendering using: In the browser open 0.0.0.0:1234 and it should be there. Thank you. |
|
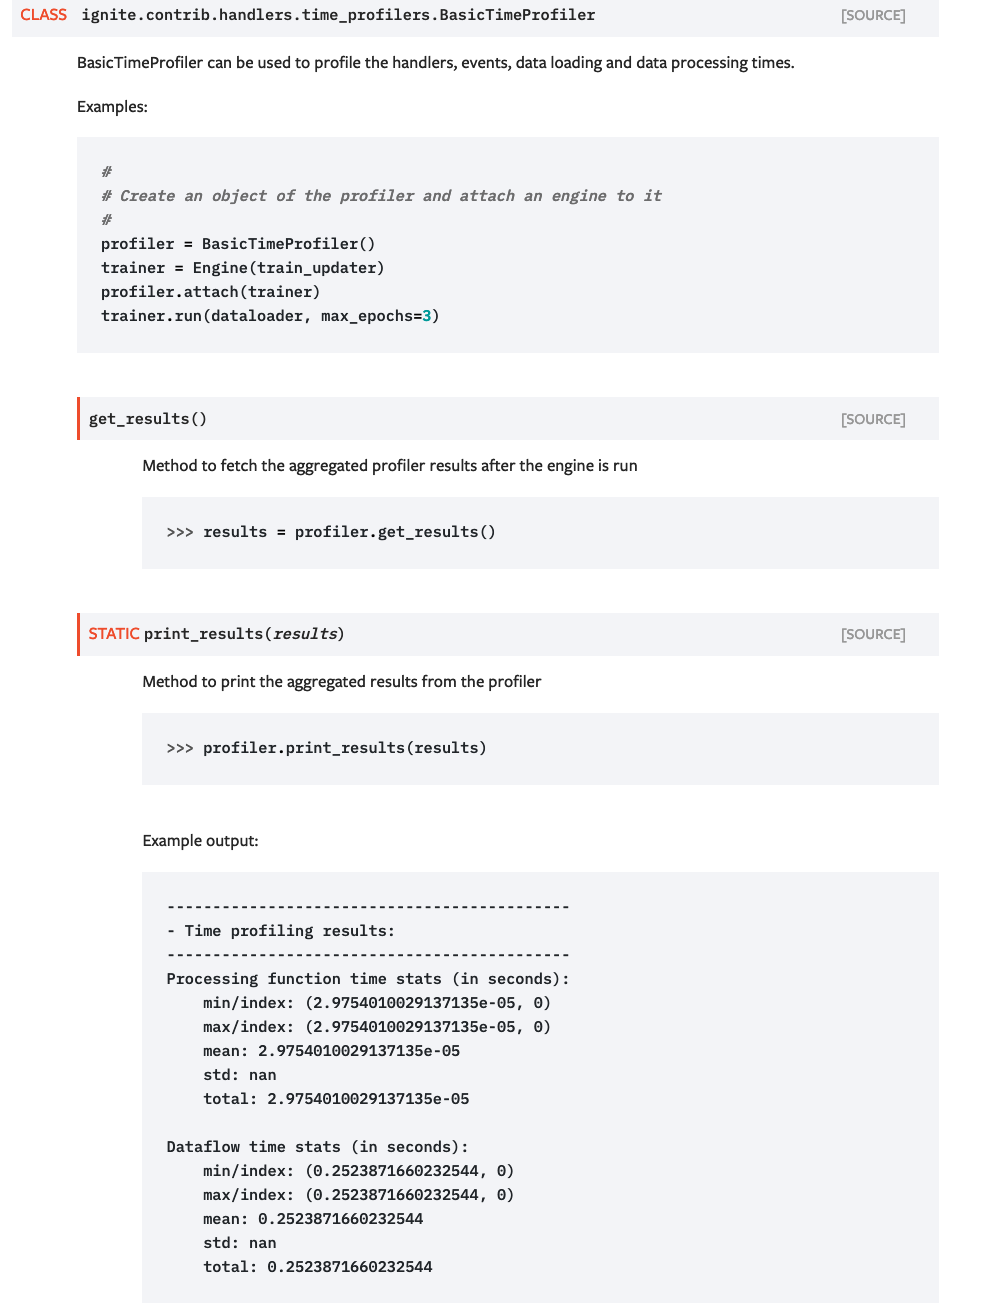
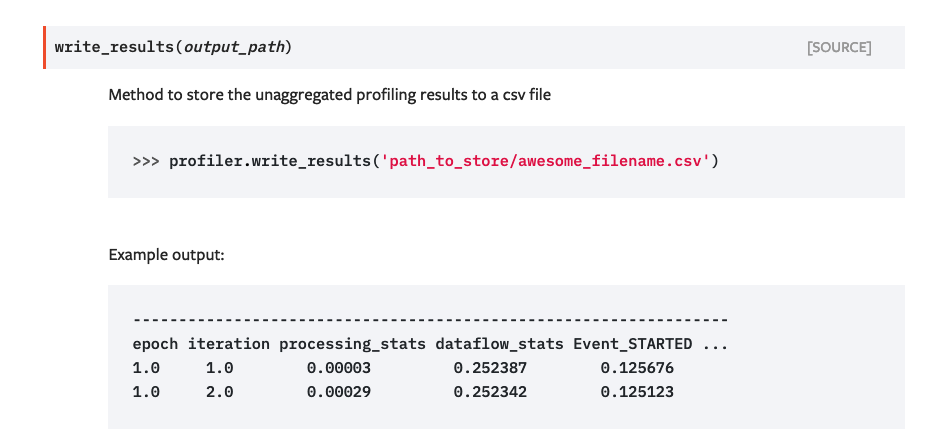
Hello @vfdev-5 Thanks! The docstring looks better formatted now. I moved the code and output examples to the corresponding function definitions, hoe that's okay. Screenshots attached below:
|
Just made one tiny change to fix these guys :D
|
Fixes #589
Description:
Check list: