Debugging the mods
In the mod source file header, add or update the line starting with @compilerOptions, by specifying the flags --optimize=0 --debug.
A couple of example source code lines with these flags added:
// @compilerOptions --optimize=0 --debug
or
// @compilerOptions -lshlwapi -lcomctl32 --optimize=0 --debug
Install Visual Studio Code.
Despite a confusingly similar name, this is a totally different program than Microsoft Visual Studio. The latter would need a more involved setup to enable mods' debugging, because Windhawk internally uses mingw target, and Microsoft Visual Studio does not support the symbol format compiled for mingw. So this instruction currently applies to using Visual Studio Code.
With the setup described below, Visual Studio Code is compatible with Windhawk mods - it nicely shows the source code, the variables, is able to set breakpoints and to step through the code.
After installing VS Code, install also the following VS Code extensions:
You do not need to manually open the Windhawk mods source folder or files there in order to debug your mod.
When you first start debugging, choose CodeLLDB as a debugger. VS Code will create a launch.json for you. You will need to edit it slightly.
The launch.json looks like following when Notepad is set as an example debug target:
{
    // Use IntelliSense to learn about possible attributes.
    // Hover to view descriptions of existing attributes.
    // For more information, visit: https://go.microsoft.com/fwlink/?linkid=830387
    "version": "0.2.0",
    "configurations": [
        {
            "type": "lldb",
            "request": "launch",
            "name": "Debug",
            "program": "C:\\Windows\\System32\\notepad.exe",
            "args": [],
            "cwd": "${workspaceFolder}"
        }
    ]
}
The above configuration launches Notepad when you start debugging in VS Code.
It seems that launching the processes via VS Code might conflict with some other software in some machines and might not work (nothing happens when you start debugging). As an alternative, attaching to a running process seems to work regardless. The instruction for attaching to a running process is below.
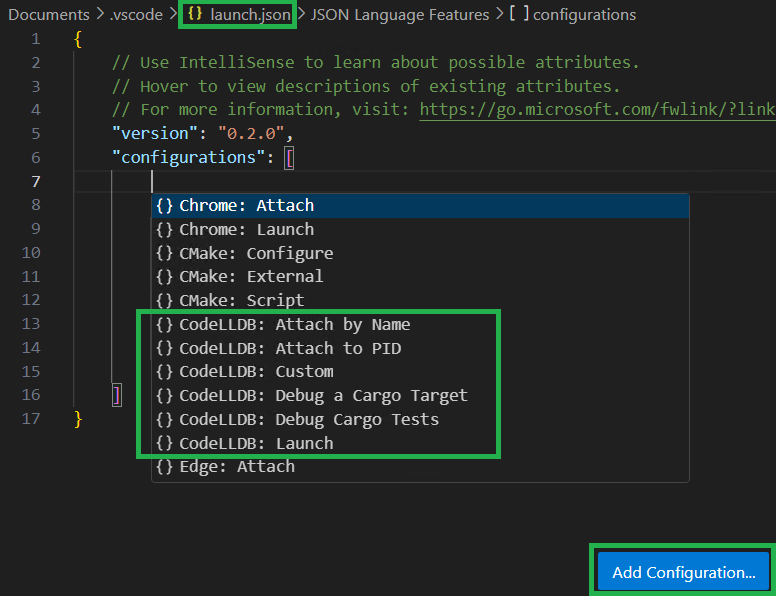
- Open launch.json
- Click on bottom right "Add configuration...". A popup menu will open in the middle of configuration file.
- Choose "CodeLLDB: Attach by Name" or "CodeLLDB: Attach to PID" option
- In the newly added configuration block, update the "program" or "pid" field accordingly
- Start debugger
If needed, then attach debugger first and then enable the mod only after that, so that the mod will not crash the process before you start debugging.
In order to conveniently break into the debugger at a suitable code line in your mod, you can use a Windows API breakpoint function.
If you want the mod code to trigger a breakpoint, then you can use the following code:
if (IsDebuggerPresent())
        DebugBreak();
IsDebuggerPresent() check is needed, else the program will crash without a debugger attached.