Have been playing around a multiclass confusion matrix. Somehow during the weekend I got updated the environment and had to reinstall all the libraries from scratch so can't produce any screenshot of what it was previously rendering correctly.
In doing so, the confusion matrix it is now plotted without gaps that makes the dataset unreadable.
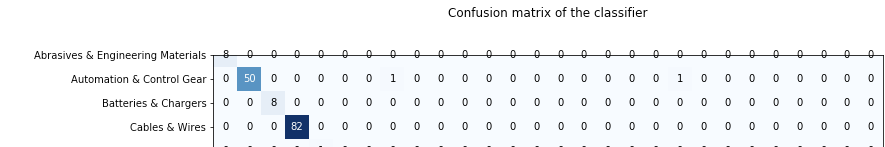
The API are quite straightforward, and I don't see what else I can change.
from mlxtend.plotting import plot_confusion_matrix
fig, ax = plot_confusion_matrix(conf_mat=cm,figsize=(12,25), class_names=numpy.unique(Y_test), show_normed=False)
ax.tick_params(axis='x', labelrotation=90)
plt.title('Confusion matrix of the classifier')
plt.show()
Looking at the figure side, increasing the size up to 40,40 didn't help either. The gap between each block increased, but not the one on the first line (and the last one).
A fig.tight_layout() didn't help either.
Removing the class names is the only chance, but this doesn't sound like an option.
Any idea?
Have been playing around a multiclass confusion matrix. Somehow during the weekend I got updated the environment and had to reinstall all the libraries from scratch so can't produce any screenshot of what it was previously rendering correctly.
In doing so, the confusion matrix it is now plotted without gaps that makes the dataset unreadable.
The API are quite straightforward, and I don't see what else I can change.
Looking at the figure side, increasing the size up to 40,40 didn't help either. The gap between each block increased, but not the one on the first line (and the last one).
A
fig.tight_layout()didn't help either.Removing the class names is the only chance, but this doesn't sound like an option.
Any idea?