A basic, simple to use, birds eye view of linux process performance monitoring
Note: Works only with python >= 3.5
git clone https://github.com/rda3mon/perfmon.git
make clean && make && sudo make install
➜ perfmon --help
usage: perfmon [-h] -p PID [-o {csv,raw,quiet}] [-i {3,5,10,20,60}]
               [-s DIRPATH] [-d]

Performance Monitoring tools

optional arguments:
  -h, --help            show this help message and exit
  -p PID, --pid PID     Process id for analysing the performance
  -o {csv,raw,quiet}, --output {csv,raw,quiet}
                        Output format. (Default - quiet)
  -i {3,5,10,20,60}, --interval {3,5,10,20,60}
                        Monitor interval in seconds (Default - 3s)
  -s DIRPATH, --dirpath DIRPATH
                        Directory path where files to be stored (Default /tmp
                        /perf-monit)
  -d, --draw            Store the output as figures (Default -- True)
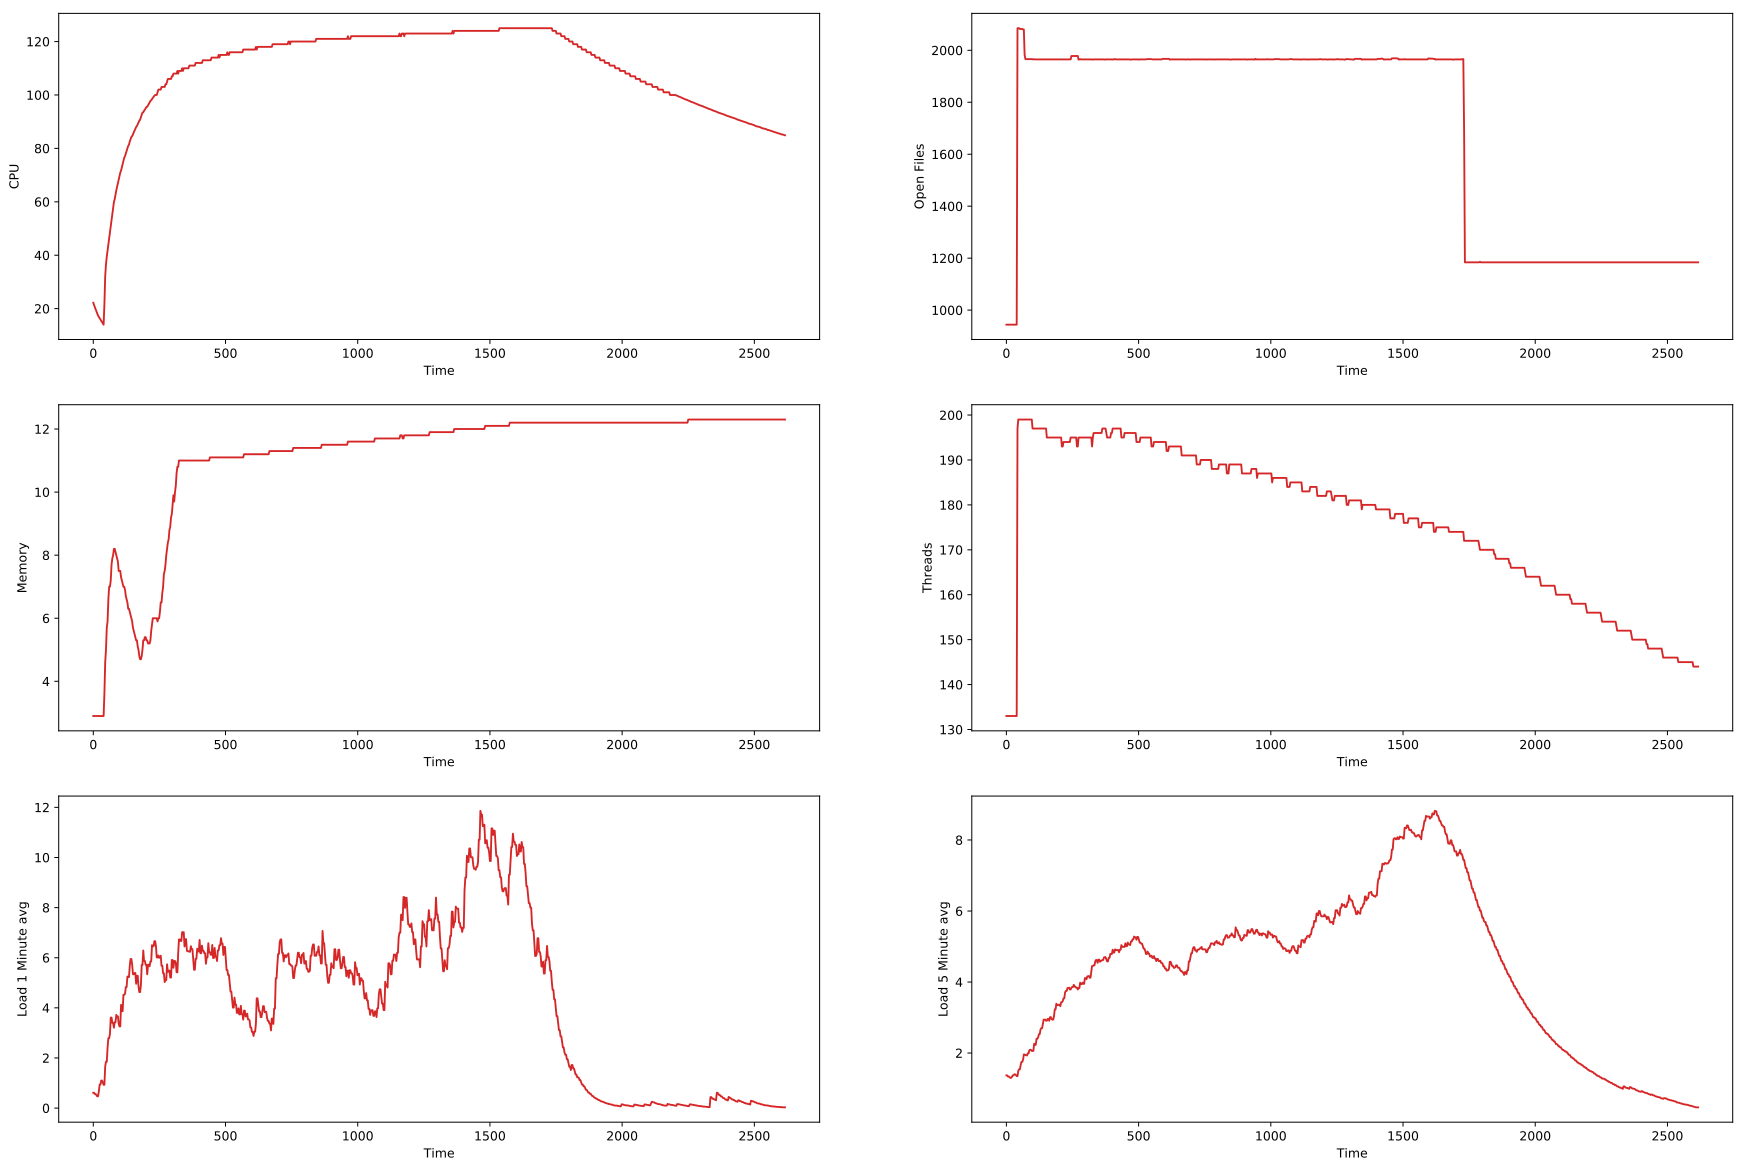
Sample Plot: