Still being edited heavily and far from a finished project
This is a graphing package that intended to simply graphing attractive graphs in Stata. In particular, this package was designed for use with survey data where respondents may have given answers such as "Unsure", "Refusal", or "Unknown". This package allows for these values using selected codes and then handles them according to the type of graph being created.
To install this package, use the package https://github.com/haghish/github.
github install robsfletch/PrettyNote that this package depends on my pretty scheme package, available at https://github.com/robsfletch/PrettyScheme, to provides the colors and style. Pretty scheme can also be easily used on its own if you are interested. In either case, this dependency will automatically be installed when you install Pretty
Use the pretty command exactly the same way you would use the twoway graphing command in stata.
sysuse auto
pretty scatter price mpg if foreign == 0
It should run correctly just like that. There are only two differences in syntax. First, when you specify the name() parameter, replace is used by default. Second, if you want to conveniently save files, just use the save() option. For example, I can create a graph named graph1 and save it under the filename PriceVsMPG.eps by running
sysuse auto
pretty scatter price mpg if foreign == 0, name("graph1") save("PriceVsMPG.eps")This package was designed for use with survey data, and so is very adept at handling coded values (e.g. refusal, unknown, not applicable, etc.). The package currently has default codes set for these, but it is easy to set other values. The default values for now are:
- Refusal: -555
- Not applicable : - 777
- Unsure: -888
- Other: -999
For example, suppose there suppose that we have some survey data that contains a wage variable and that some respondents refused to reveal their wages. We can simulate this data
sysuse nlsw88, clear
replace wage = -555 if inlist(_n, 11, 342, 579, 180, 799, 1400)
Now, when we plot the wage data as a histogram, these values will show up as refusals on the far right of the graph.
pretty hist wage, name("graph1")
Another feature of this package is the ability to conveniently handle data on a logarithmic scale -- particularly with regards to histograms. In the last example, we may think that wage is log normal. We can easily this by including the logbase option where we specify the base value.
pretty (hist wage, logbase(1.2))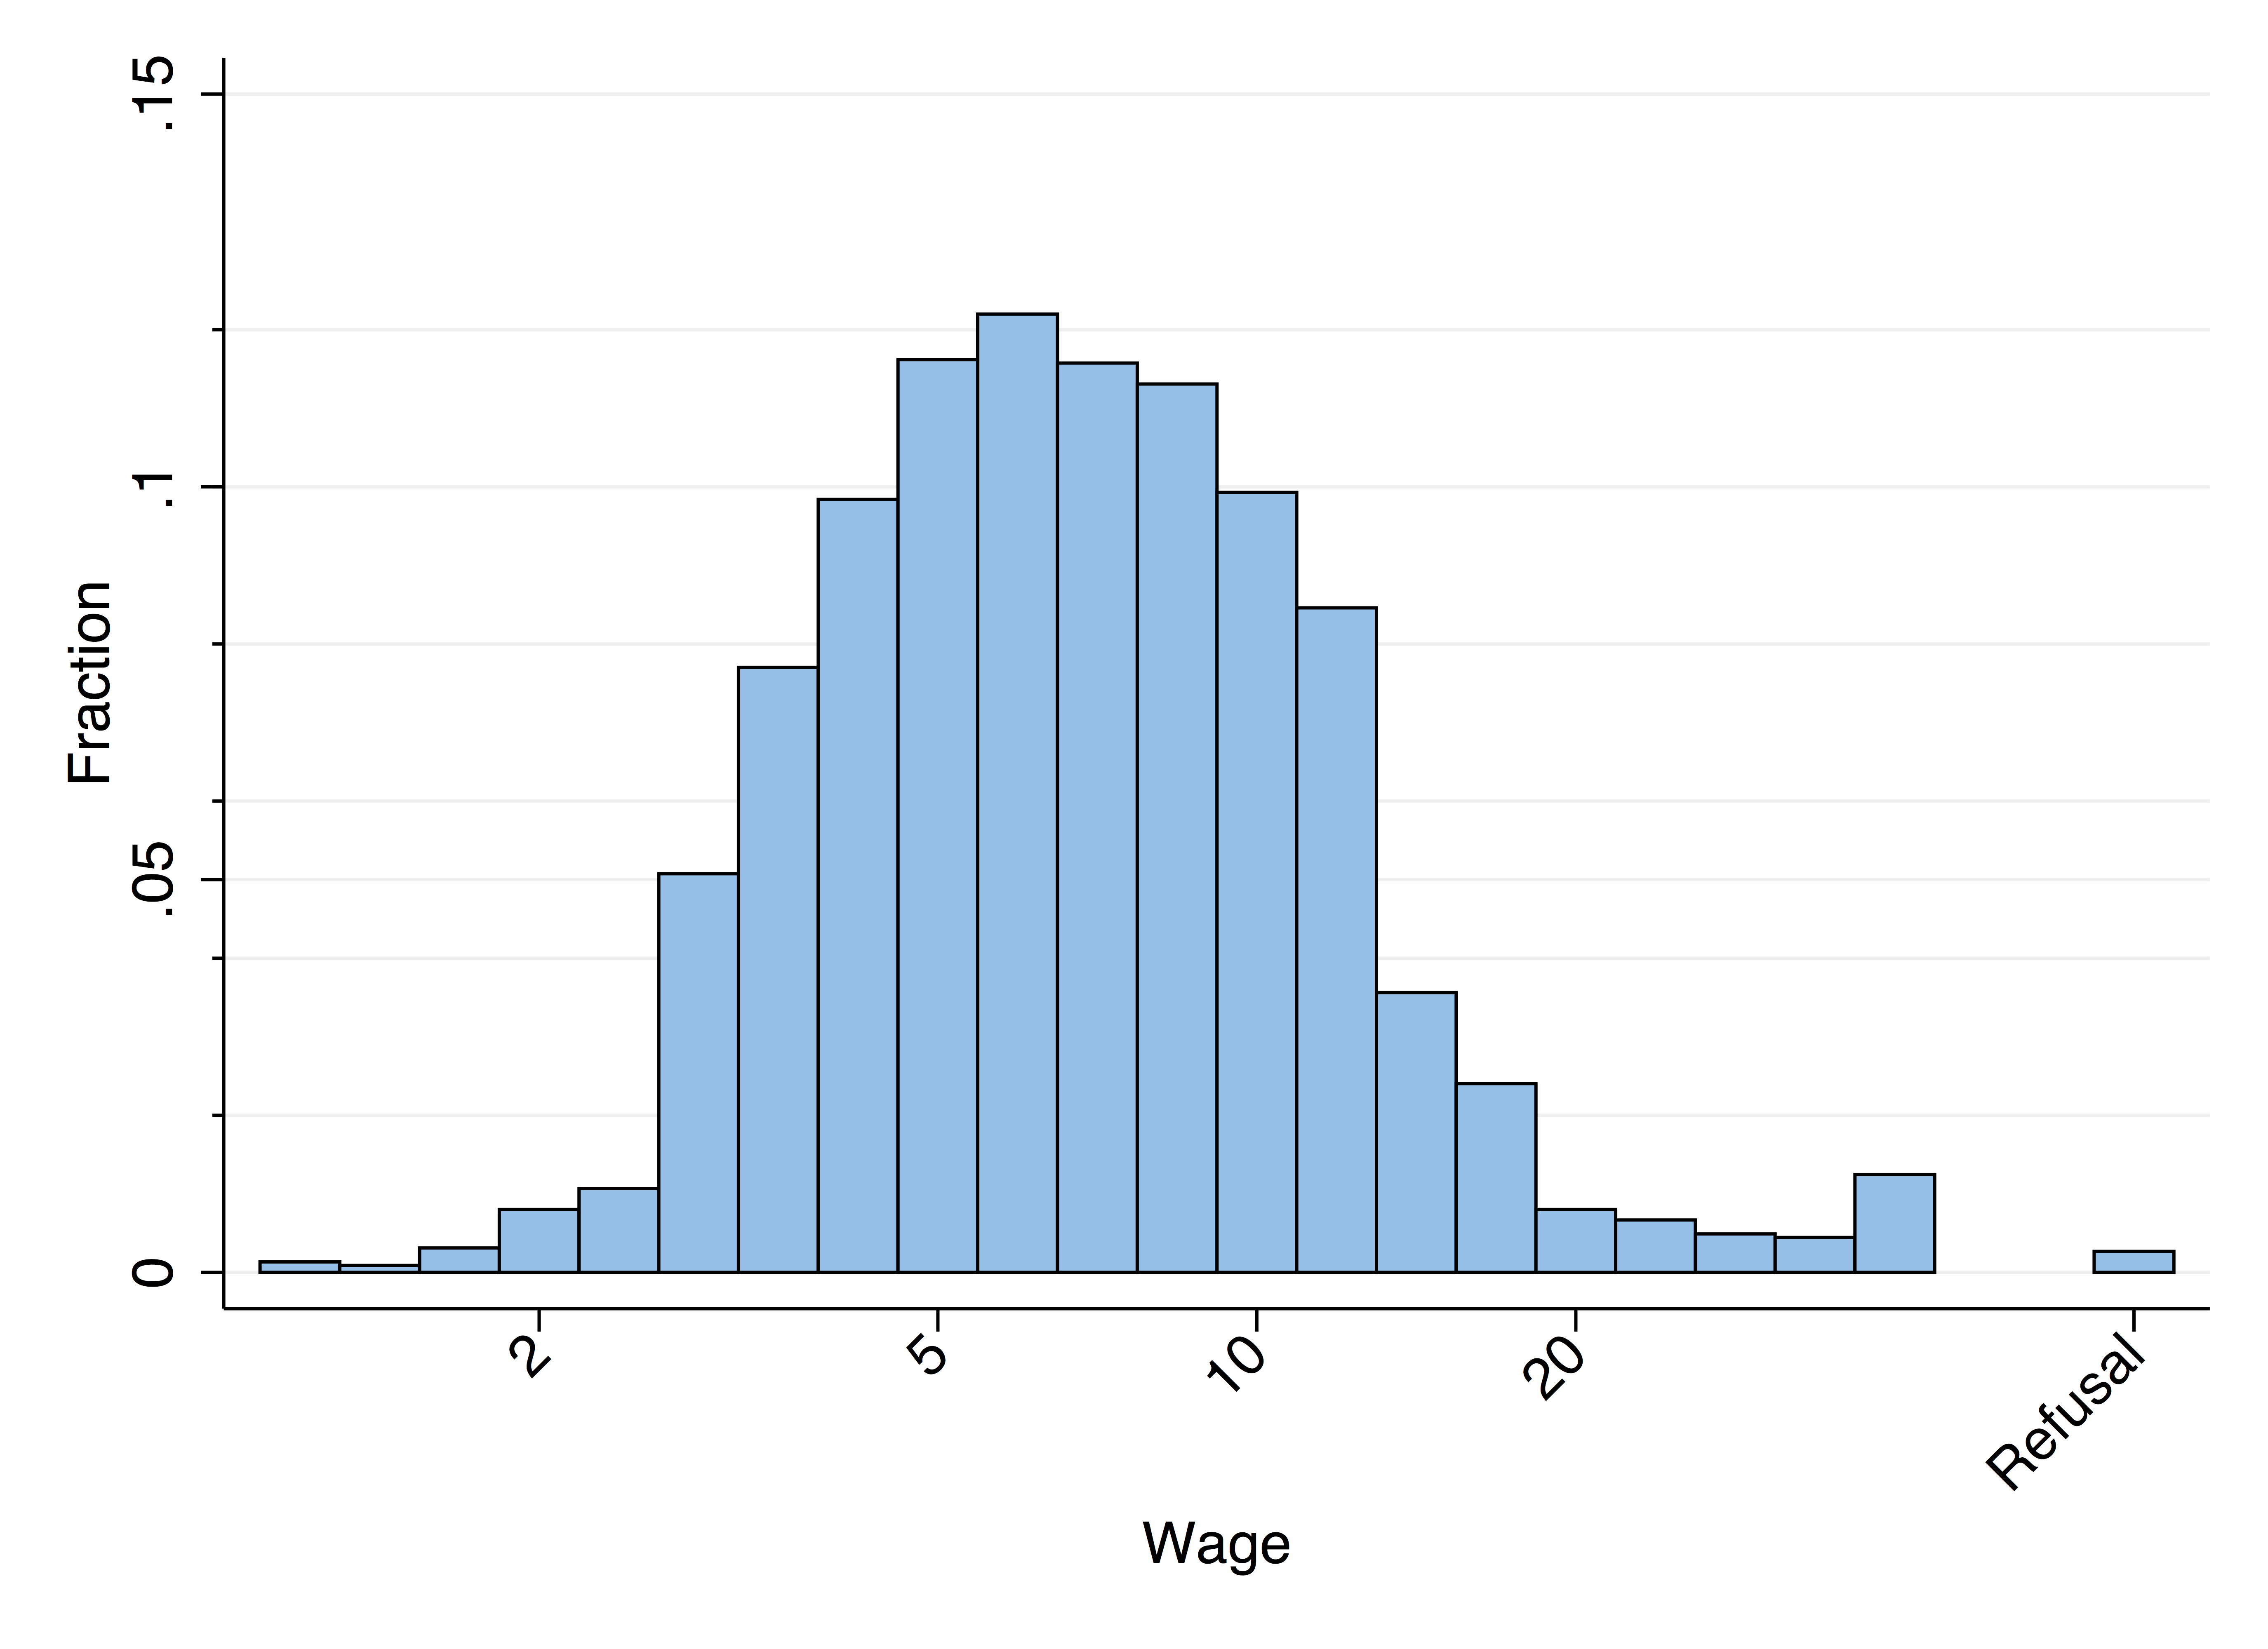
github uninstall PrettyI haven't really got the subtitle with the observation count fully working yet. It generally works, but please be cautious. It's easy to comment out that part of the code if it's a problem, so feel free to ask me if it's a problem.