Researching the OkCupid dating profile data set using machine learning models to predict user star sign 'intensity'.
- Project Summary
- Expectations
- Pipeline Info
- Dataset and Features
- Technologies
- Machine Learning Models
- Results
- Citations
- Special Thanks
- Contributors
This project involves the assessment of twelve machine learning models using the 2012 OkCupid dataset. This study aims to evaluate the performance of these models and determine which is most effective at classifying a user’s ‘Star Sign Intensity’. The performance of each model was evaluated based on metrics including accuracy, precision, recall, F1 score, and associated learning curves. Model selection, for each algorithm, compared three independent train/test splits (50-50, 70-30, and 80-20) before undergoing 10-fold cross-validation. The results of which were compared and the best models (by metrics) for each were selected by hand. The findings of this study do not necessarily support much in the way of predicting a human’s interest in star signs in the given context but do provide valuable insights into the appropriate selection of machine learning models and algorithms for any application.
- Model initialization: All models were initialized with random_state = 1234 for reproducibility whenever possible
- Data splits: The models were trained on 3 splits of the dataset in 3 ratios (50-50, 70-30, 80-20)
- Cross validation: For every split, every model is trained using 10-fold cross validation of the training set, from which the best model is selected.
- For classification models, we primarily used accuracy as the determining metric as our dataset is largely evenly split (47-53).
- From the best models chosen for every split, we choose the best model for every model type.
- Finally, from all the models we choose a single best performer.
- Notes on model evaluation: models that perform close to or worse than 0.53 (always guessing a single class) will be classified as poorly performing.
Dataset obtained from Kaggle.com
OkCupid is a mobile dating app. It sets itself apart from other dating apps by making use of a precomputed compatibility score, calculated by optional questions the users may choose to answer. In this dataset, there are 60k records containing structured information such as age, sex, orientation as well as text data from open ended descriptions.
- age, status, sex, orientation, body_type, diet, drinks, drugs, education, ethnicity, height, income, job, last_online, location, offspring, pets, religion, sign, smokes, speaks, essay0, essay1, essay2, essay3, essay4, essay5, essay6, essay7, essay8, essay9
- 59,949 raw entries
- .csv format
For training and predicting, all used features were converted to numeric or binary data. These features are labeled with '_data' for use as an official for use in training and testing the models.
The following fields were used for classification:
'age', 'height', 'income', 'sign_data', 'religion_data', 'religion_intensity', 'status_data', 'sex_data', 'height_data', 'orientation_data', 'body_type_data', 'diet_data' 'drinks_data', 'drugs_data', 'education_data', 'job_data', 'last_online_data', 'offspring_data', 'smokes_data', 'speaks_data', 'essay0_data', 'essay1_data', 'essay2_data', 'essay3_data', 'essay4_data', 'essay5_data', 'essay6_data', 'essay7_data', 'essay8_data', 'essay9_data', 'essay_len'.
Since predicting a persons Astrological Sign was not a solvable problem with this data set and these techniques an alternative metric was used: Star Sign Intensity. Star Sign Intensity is a composite feature based on self-reported OkCupid survey data representing one’s affinity or interest in their zodiac sign. This data was reported as part of the original column but separated by a comma from the original sign value. For example, an entry might contain "Leo, and it matters a lot'. The three possible options for this sub-field were combined into two to create a binary classification problem: "My sign matters" and "My sign doesn't matter".

- Decision Tree Classifier
- Support Vector Machine (Linear Kernel)
- Support Vector Machine (RBF Kernel)
- Perceptron
- Multi Layer Perceptron
- Naive Bayes Classification
- Logistic Regression
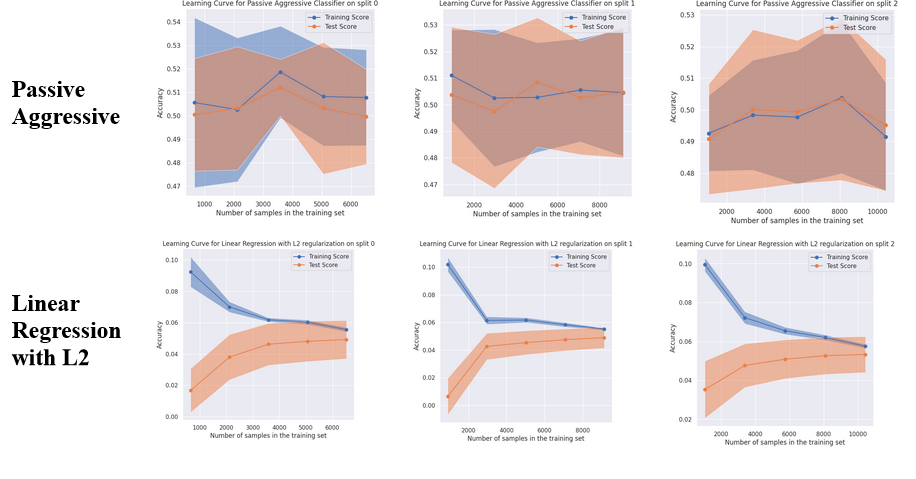
- Linear Regression
- Gradient Boosting
|
Split 0 (50/50) |
Accuracy |
Precision |
Recall |
F1-Score |
|
Decision Tree |
0.59 |
0.59 |
0.59 |
0.59 |
|
Perceptron |
0.51 |
0.5 |
0.51 |
0.48 |
|
Naive Bayes |
0.51 |
0.52 |
0.51 |
0.48 |
|
Logistic Regression |
0.6 |
0.59 |
0.6 |
0.59 |
|
SVM - Linear Kernel |
0.59 |
0.59 |
0.59 |
0.59 |
|
SVM - RBF Kernel |
0.5 |
0.51 |
0.5 |
0.47 |
|
Multilayer Perceptron |
0.53 |
0.54 |
0.53 |
0.51 |
|
Gradient Boosting |
0.61 |
0.61 |
0.61 |
0.61 |
|
Ridge Regression |
0.6 |
0.6 |
0.6 |
0.6 |
|
K-Nearest Neighbors |
0.51 |
0.51 |
0.51 |
0.51 |
|
Passive Aggressive |
0.52 |
0.49 |
0.52 |
0.37 |
|
Split 1 (70/30) |
Accuracy |
Precision |
Recall |
F1-Score |
|
Decision Tree |
0.61 |
0.61 |
0.61 |
0.61 |
|
Perceptron |
0.51 |
0.49 |
0.51 |
0.46 |
|
Naive Bayes |
0.55 |
0.55 |
0.55 |
0.55 |
|
Logistic Regression |
0.6 |
0.6 |
0.6 |
0.6 |
|
SVM - Linear Kernel |
0.59 |
0.6 |
0.59 |
0.59 |
|
SVM - RBF Kernel |
0.49 |
0.5 |
0.49 |
0.46 |
|
Multilayer Perceptron |
0.52 |
0.52 |
0.52 |
0.51 |
|
Gradient Boosting |
0.62 |
0.62 |
0.62 |
0.62 |
|
Ridge Regression |
0.6 |
0.6 |
0.6 |
0.6 |
|
K-Nearest Neighbors |
0.51 |
0.51 |
0.51 |
0.51 |
|
Passive Aggressive |
0.53 |
0.52 |
0.53 |
0.45 |
|
Sprint 2 (80/20) |
Accuracy |
Precision |
Recall |
F1-Score |
|
Decision Tree |
0.62 |
0.62 |
0.62 |
0.62 |
|
Perceptron |
0.5 |
0.48 |
0.5 |
0.45 |
|
Naive Bayes |
0.55 |
0.55 |
0.55 |
0.55 |
|
Logistic Regression |
0.59 |
0.59 |
0.59 |
0.59 |
|
SVM - Linear Kernel |
0.58 |
0.59 |
0.58 |
0.58 |
|
SVM with RBF Kernel |
0.49 |
0.5 |
0.49 |
0.46 |
|
Multilayer Perceptron |
0.53 |
0.53 |
0.53 |
0.53 |
|
Gradient Boosting |
0.61 |
0.61 |
0.61 |
0.61 |
|
Ridge Regression |
0.59 |
0.59 |
0.59 |
0.59 |
|
K-Nearest Neighbors |
0.5 |
0.5 |
0.5 |
0.5 |
|
Passive Aggressive |
0.53 |
0.44 |
0.53 |
0.37 |
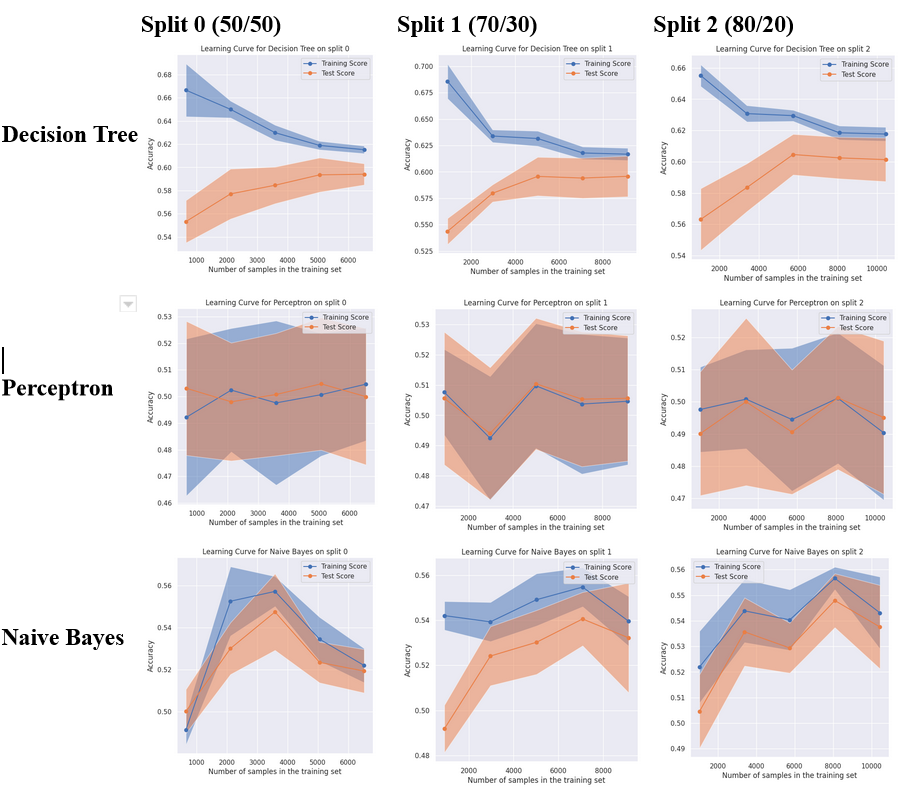
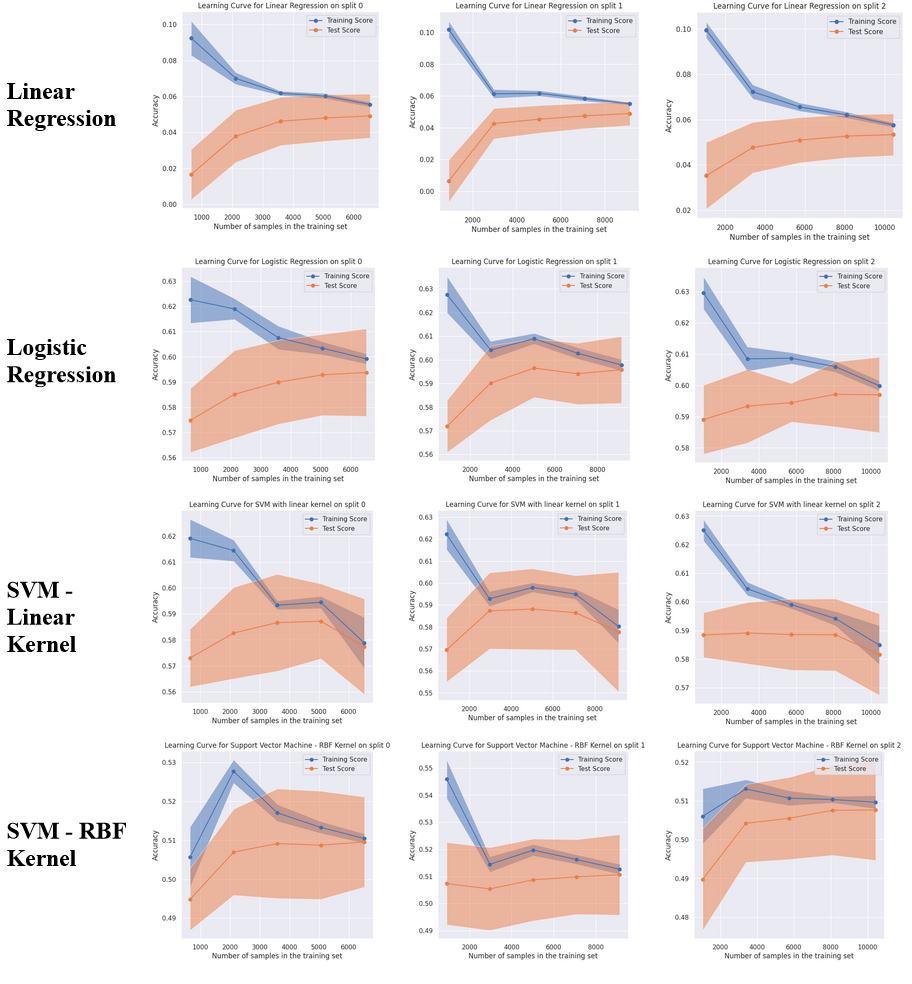
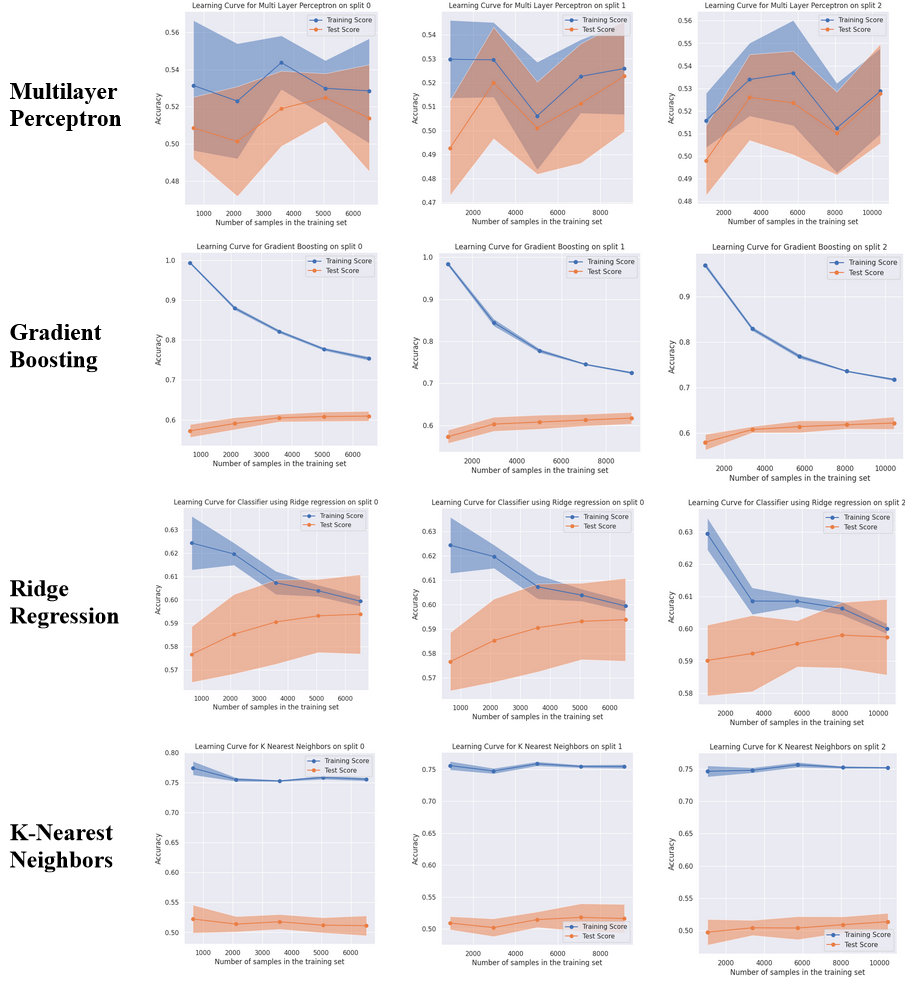
The best performing algorithms on this classification problem were Decision Tree (F1 of 0.62 on split 2), Gradient Boosting (F1 of 0.62 on Split 1) and Logistic regression (F1 of 0.60 on split 1). Overall, Decision Tree was chosen as the winning algorithm.
Some of the poorer performing models include Perceptron and SVM with RBF Kernel, which consistently achieve scores worse than simply predicting a single class. The Passive aggressive classifier also tends to perform poorly, achieving an F1-Score below 0.4 in two of the three splits.
F. Pedregosa et al., “Scikit-learn: Machine Learning in Python,” Journal of Machine Learning Research, vol. 12, pp. 2825–2830, 2011.
- B. Resnick, "Researchers just released profile data on 70,000 OkCupid users without permission" Vox, May 12, 2016. [Online]. Available: https://www.vox.com/2016/5/12/11666116/70000-okcupid-users-data-release.
- E. Kirkegaard, "Intelligence and religiosity among dating site users" ResearchGate, December 2019. [Online]. Available: https://www.researchgate.net/publication/338125762_Intelligence_and_Religiosity_among_Dating_Site_Users.
- G. Suarez-Tangil, M. Edwards, C. Peersman, G. Stringhini, A. Rashid, M. Whitty, “Automatically Dismantling Online Dating Fraud”, 2020 IEEE Transactions on Information and Security
- C. van der Lee, T. van der Zanden, E. Krahmer, M. Mos, and A. Schouten, “Automatic identification of writers’ intentions: Comparing different methods for predicting relationship goals in online dating profile texts” in Proceedings of the 5th Workshop on Noisy User-generated Text (W-NUT 2019), Nov. 2019, pp. 94–100. doi: 10.18653/v1/D19-5512.
- D. Boller, M. Lechner, and G. Okasa, The Effect of Sport in Online Dating: Evidence from Causal Machine Learning. 2021.
- I. Backus, "Predicting Gender from OKCupid profiles using ensemble methods" self published, Mar. 22, 2018. [Online]. Available: https://raw.githubusercontent.com/wiki/ibackus/okcupid-gender-prediction/okcupid_gender_prediction.pdf.
- M. Campbell, "Investigating OkCupid profiles: Can we predict someone's city?" Medium, July 21, 2022. [Online]. Available: https://medium.com/@macrotentional/investigating-okcupid-profiles-can-we-predict-someones-city-31a4734e96dd.
The 'star sign' team would like to thank our Professor Dr. Juan M. Banda for guiding us this semester!
![]()
![]()
Contributions to this Github repository do not necessarily reflect contributions to the project as a whole. Code and textual content were worked on collaboratively by all team members, and then uploaded here for final submission