- This is an informal repository of scripts I have created for bioinformatics analysis
- It is definitely a work in progress and mainly an effort at organizing my larger and/or more useful scripts
- Runs
kraken2and analyzes which organisms the reads in the sample may be from KrakenPiePlots.pyis used within the RunK2.sh script
- Exctracts region(s) of interest from an MSA and outputs the regions into a fasta file
- Example usage:
./pull-msa-regions.py -i input-msa.fa -o output.fa -r 100:250- Output the regions between nucleotides 100 and 250
- Example usage:
./pull-msa-regions.py -i input-msa.fa -o output.fa --multi-region "100:250, 400:600, 7000:9500"- Output the alignments within the each of the regions into an fasta file
- Script to calculate Tajima's D from a given MSA file
- Example usage:
./TajimasD.py -f MSA.aln.fa
- Script to perform Monter Carlo estimation of Log-Odds Ratio comparisons for groups between two different populations
- Example usage:
./MC-LOR-comp.py -f file.tsv --pop-col Study --group-col CC --colors "green, gray, red"
  -h, --help            show this help message and exit
  -f F, --file F        File containing the data. Rows are samples and columns are variables
  --pop-col POP_COL     Column in given file that should be used to separate the populations
  --group-col GROUP_COL
                        Column in given file that should be used to separate the groups within the populations
  --pop-order POP_ORDER
                        Order of populations for plotting. First group is the numerator and appears with the first color supplied.
  --niter NITER         Number of iterations to perform the bootstrapping (default: 500)
  -k K, --k-samples K   Number of samples to bootstrap (default: 200)
  -a ALPHA, --alpha ALPHA
                        Significance cut-off for Monte Carlo estimation (default: 0.05)
  --title TITLE         Title for generated plot
  --colors COLORS       Specify the colors to use for plotting as a string separated by a comma
                                NOTE: color 1 is for the elevated groups, color 2 is for groups that are similar, and color 3 is for groups that are elevated in population 2
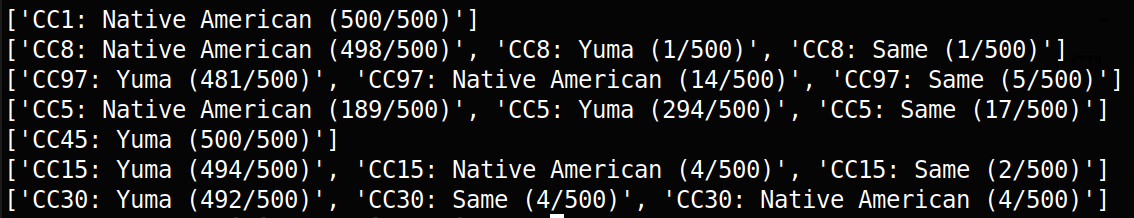
- After the script runs, it will also print out statistics for the bootstrapped significance values for each group as shown below